Learning that makes impact.
Report the four things that actually change: how people react, what they learn, what they do, and what it delivers.
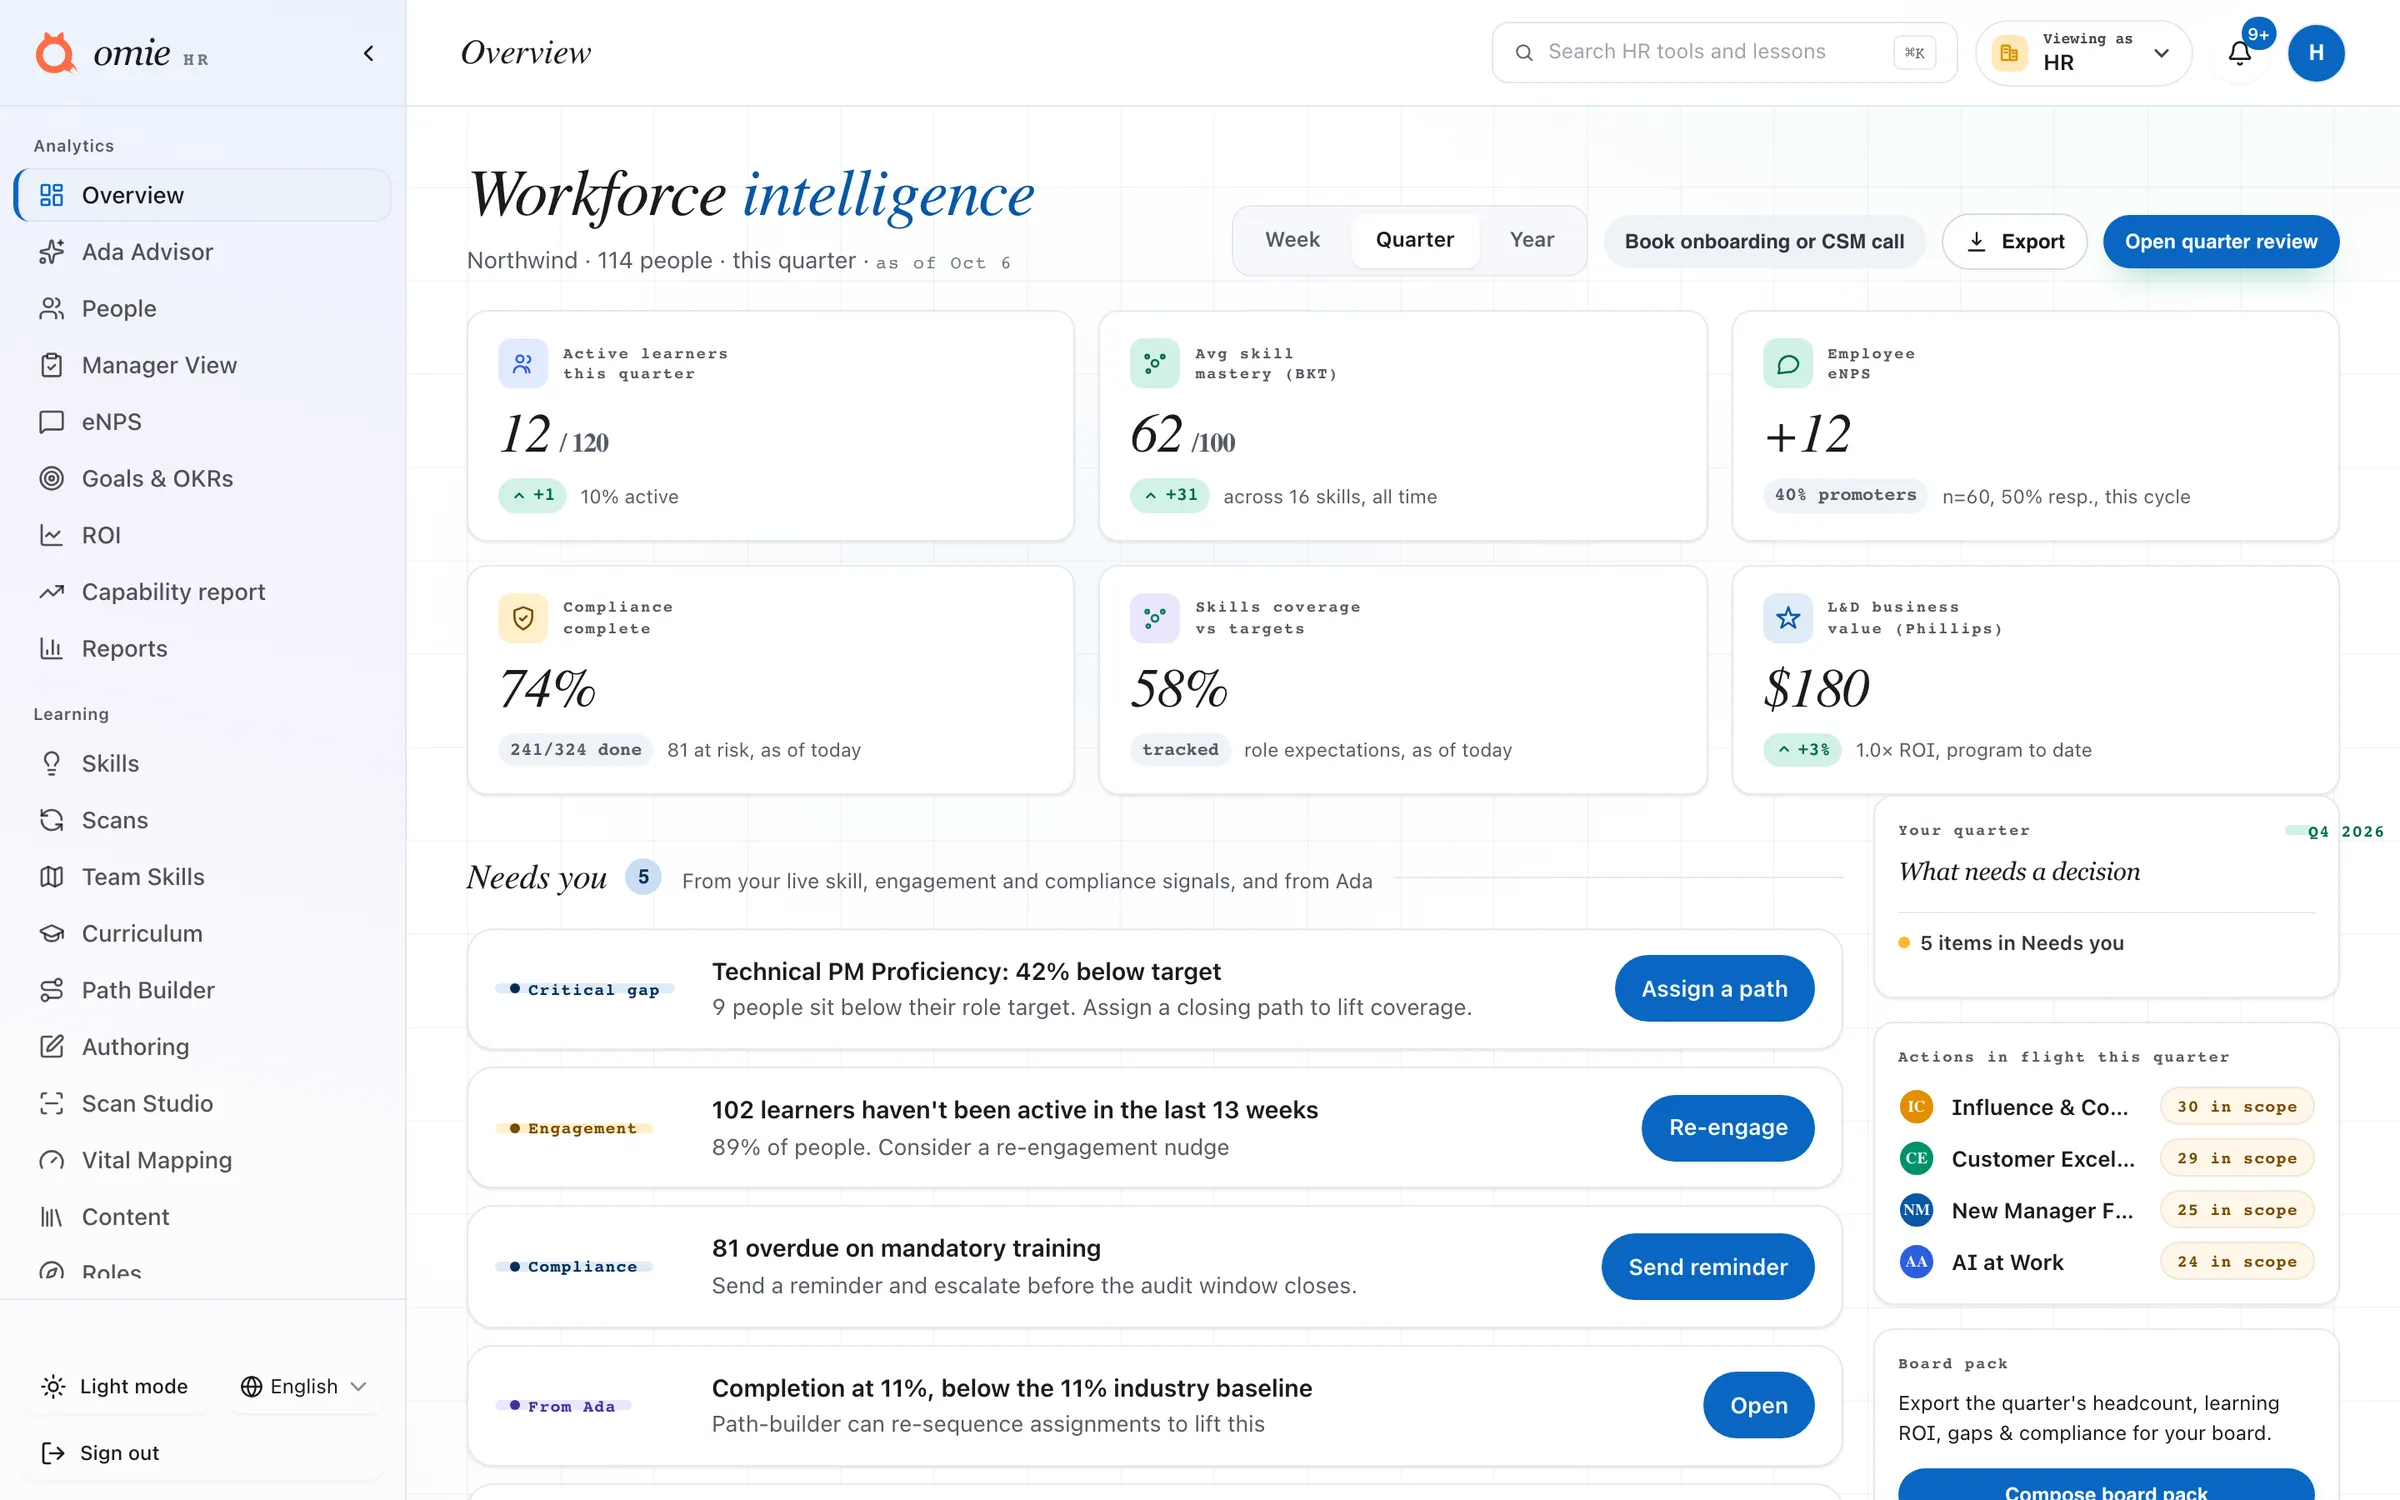
Completions are not capability.
A completion rate says people clicked to the end. It cannot say what they can do now, or what that is worth. Omie measures the second thing, then prices it.
Four levels that actually matter.
Donald Kirkpatrick named them in 1959, and they still ask the only questions a board cares about. Omie reports all four from live learner activity, not a survey filled in after the fact.
Reaction
Did people rate the learning as useful. Employee eNPS and satisfaction, read from the people doing the work, not a smile sheet at the end of a course.
Learning
Did mastery actually move. Bayesian Knowledge Tracing turns every answer into an honest reading, so a skill climbs instead of a bar filling.
Behavior
Is the skill showing up in the work. Scanned mastery is compared to the band the role should hit, person by person and team by team.
Results
What did it deliver for the business. Coverage held, gaps closed, and compliance met, rolled up into one view for the quarter.
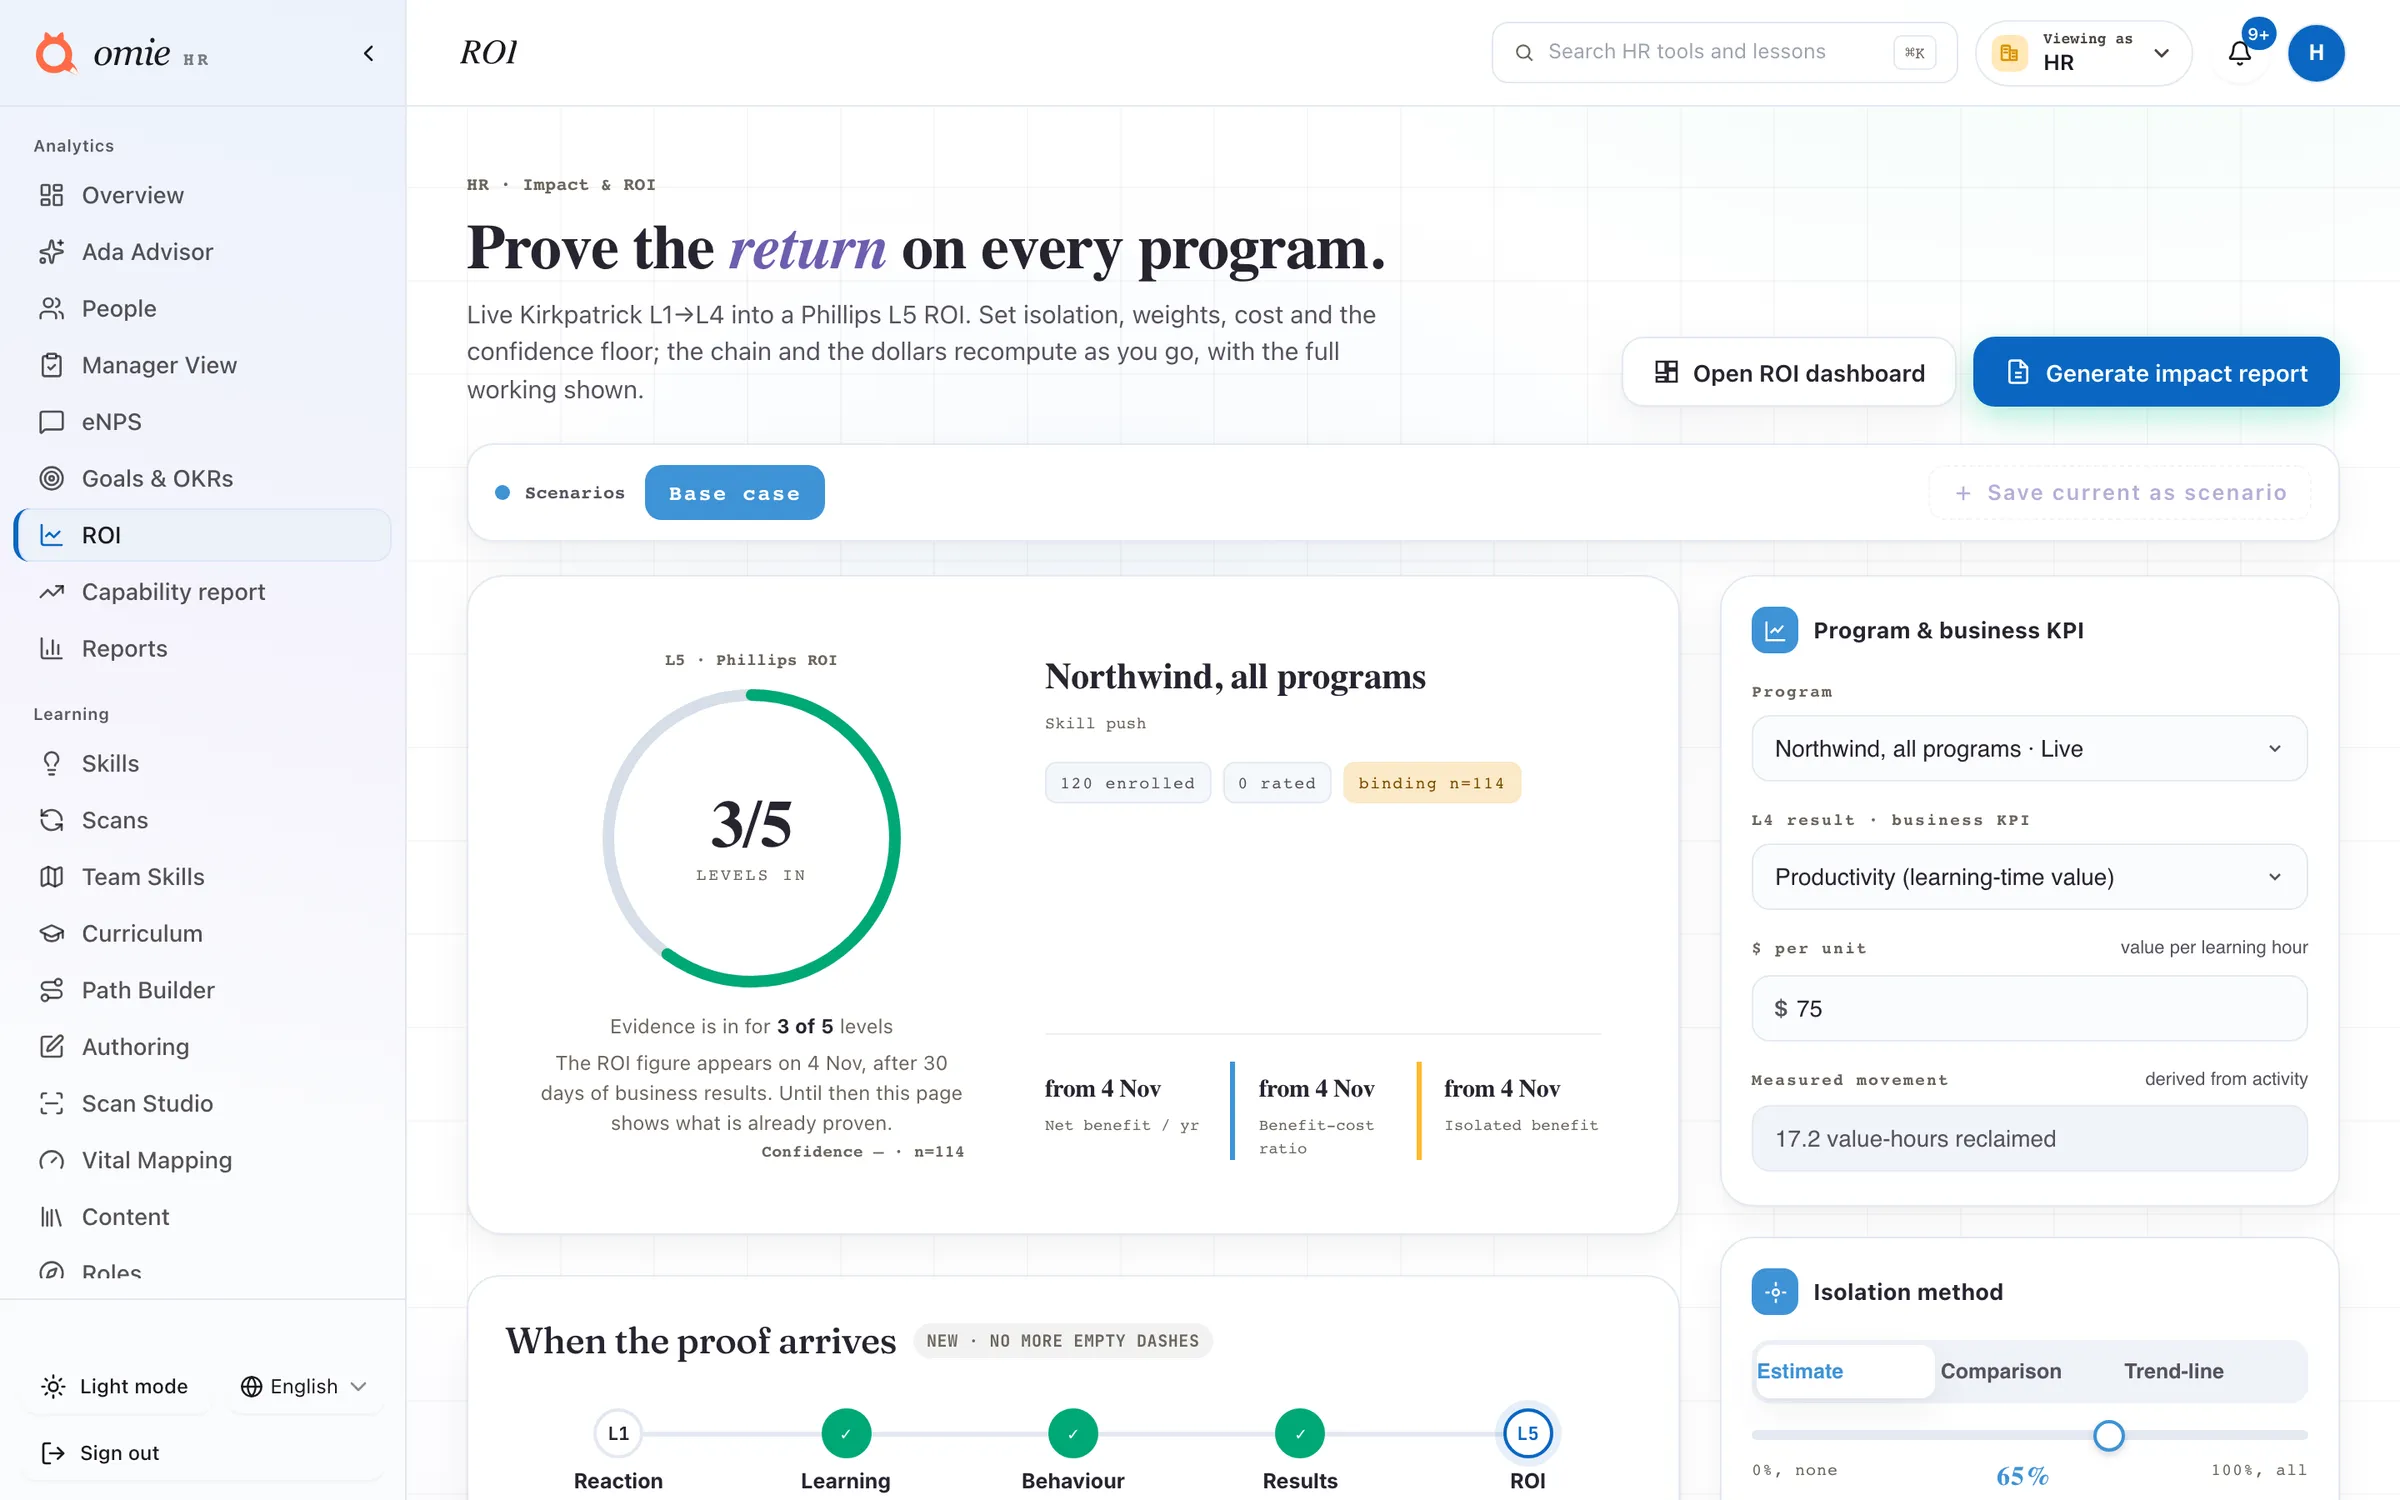
Prove it, in dollars.
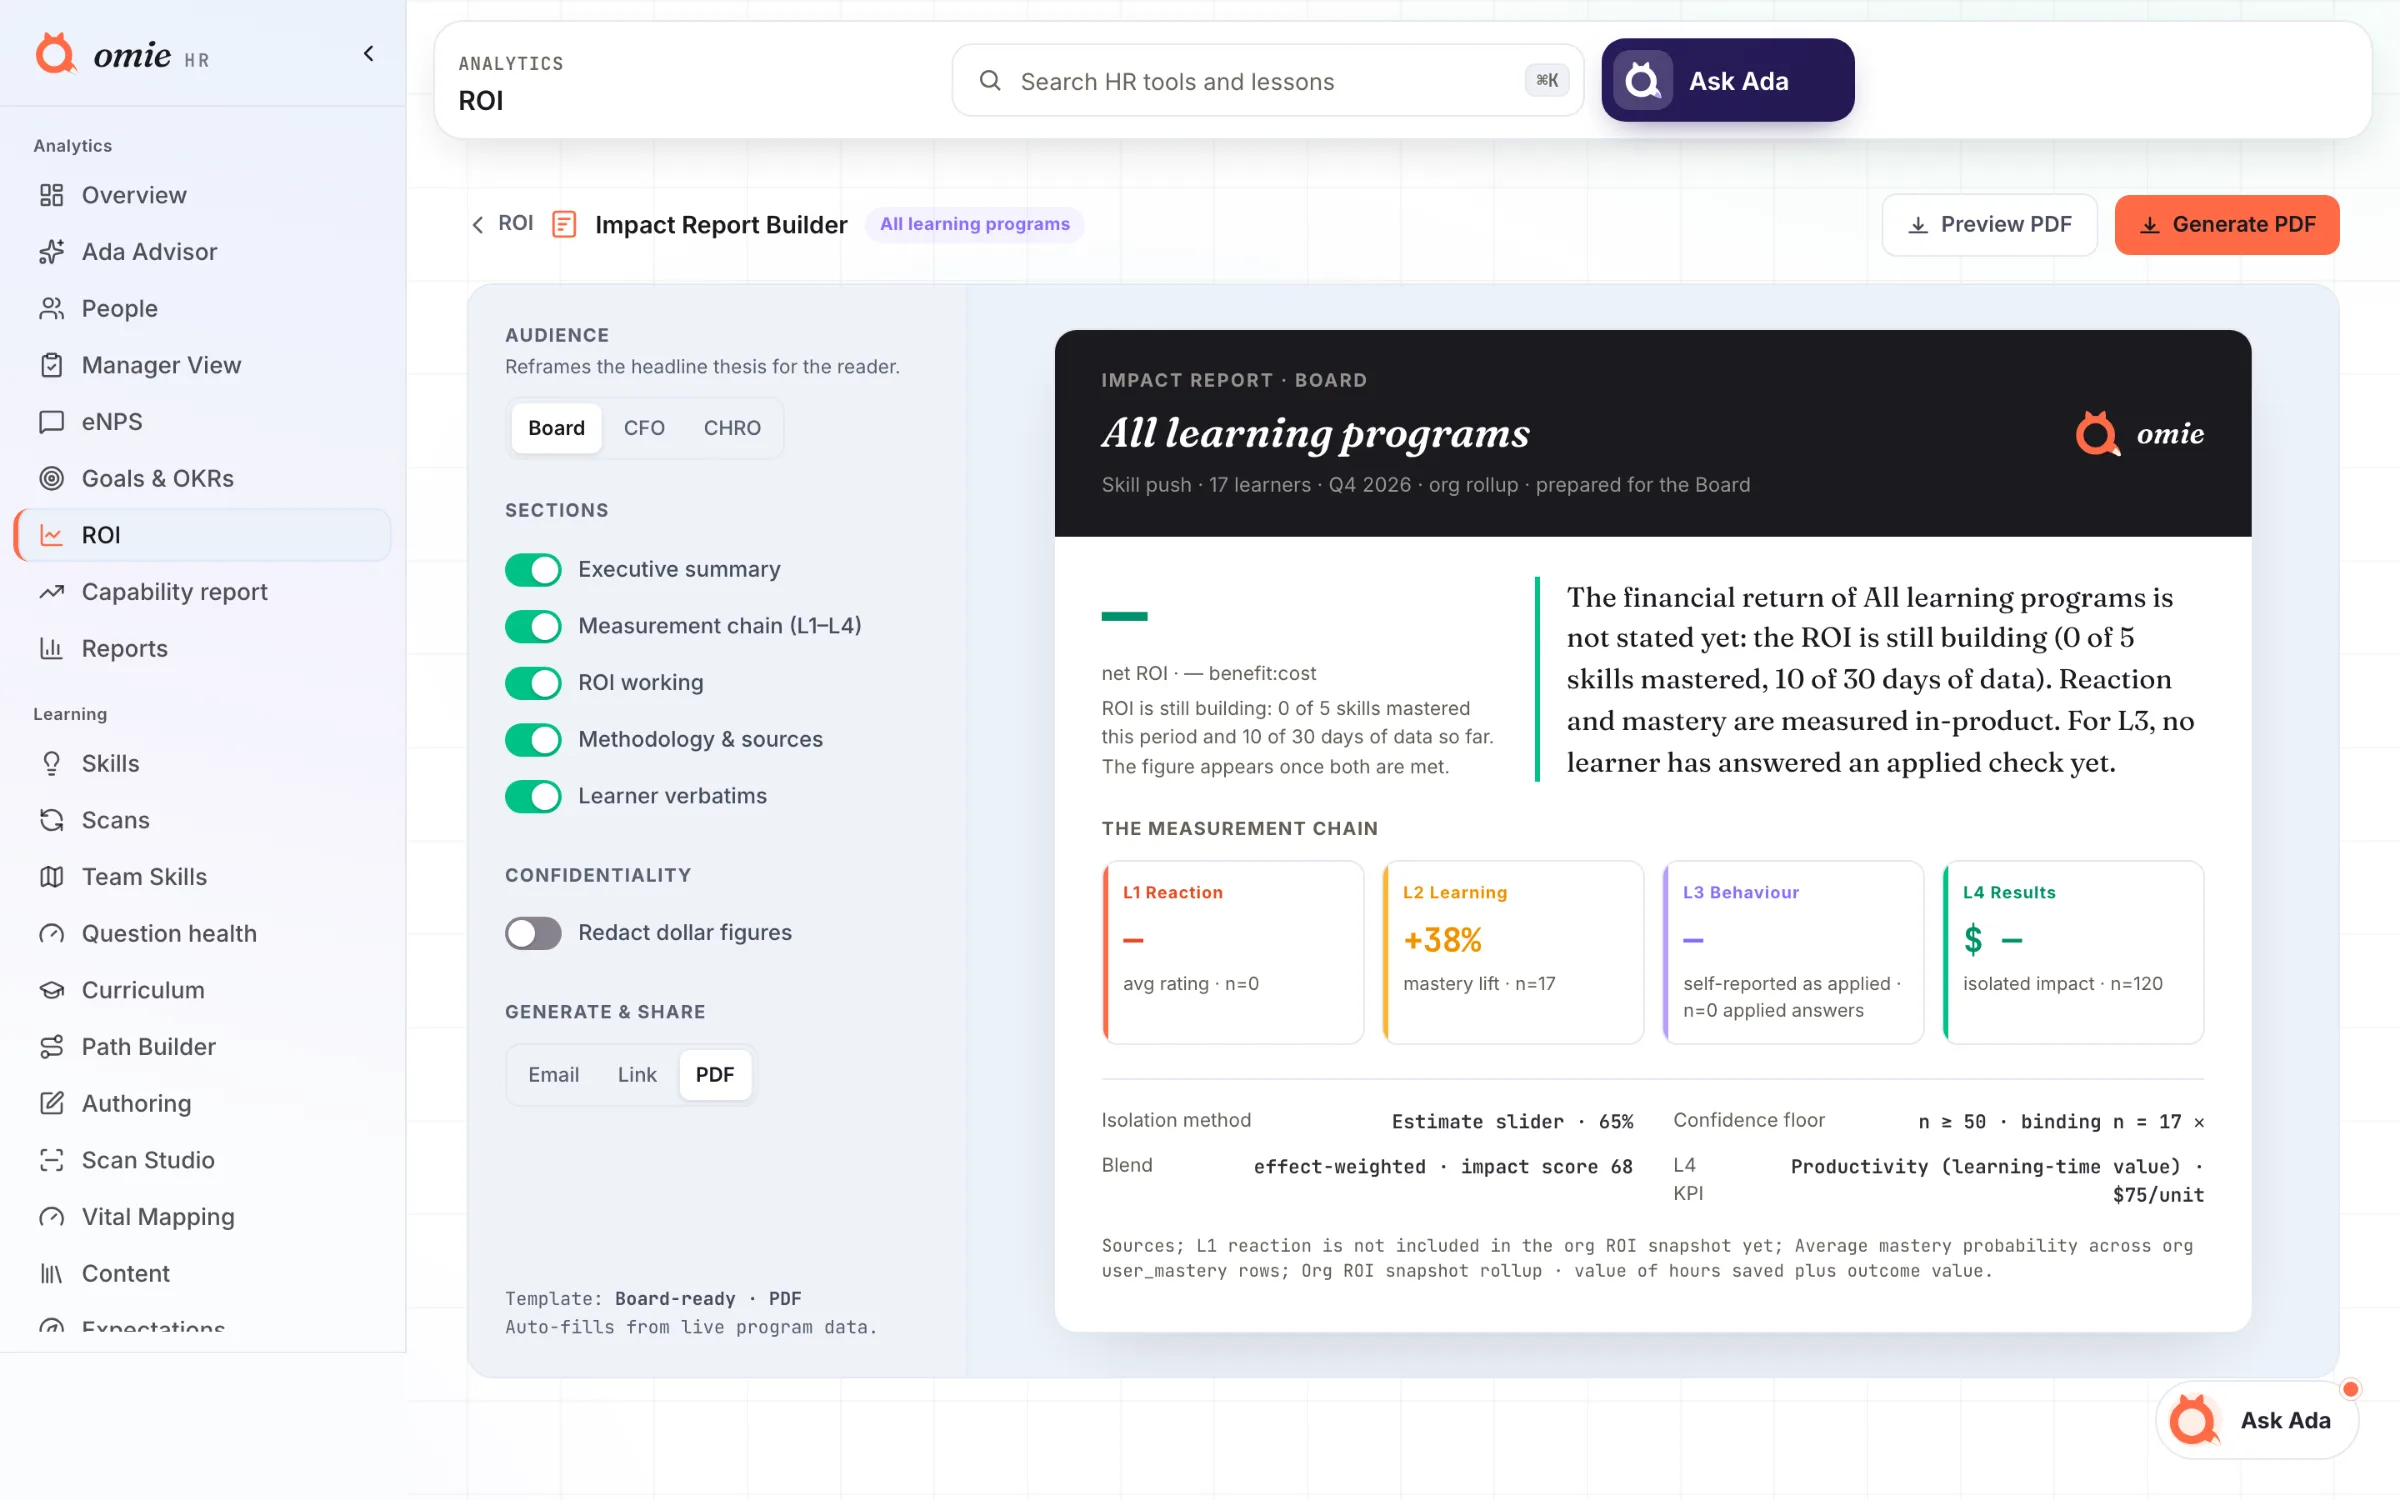
Kirkpatrick gives you the four levels. Phillips goes one step further and prices the whole program in dollars. The overview shows both on one screen, and every figure traces back to real learner signals.
- Levels one to four, scored from live learner activity
- Phillips ROI as a dollar figure your CFO can read
- Export the quarter or open the review in one click
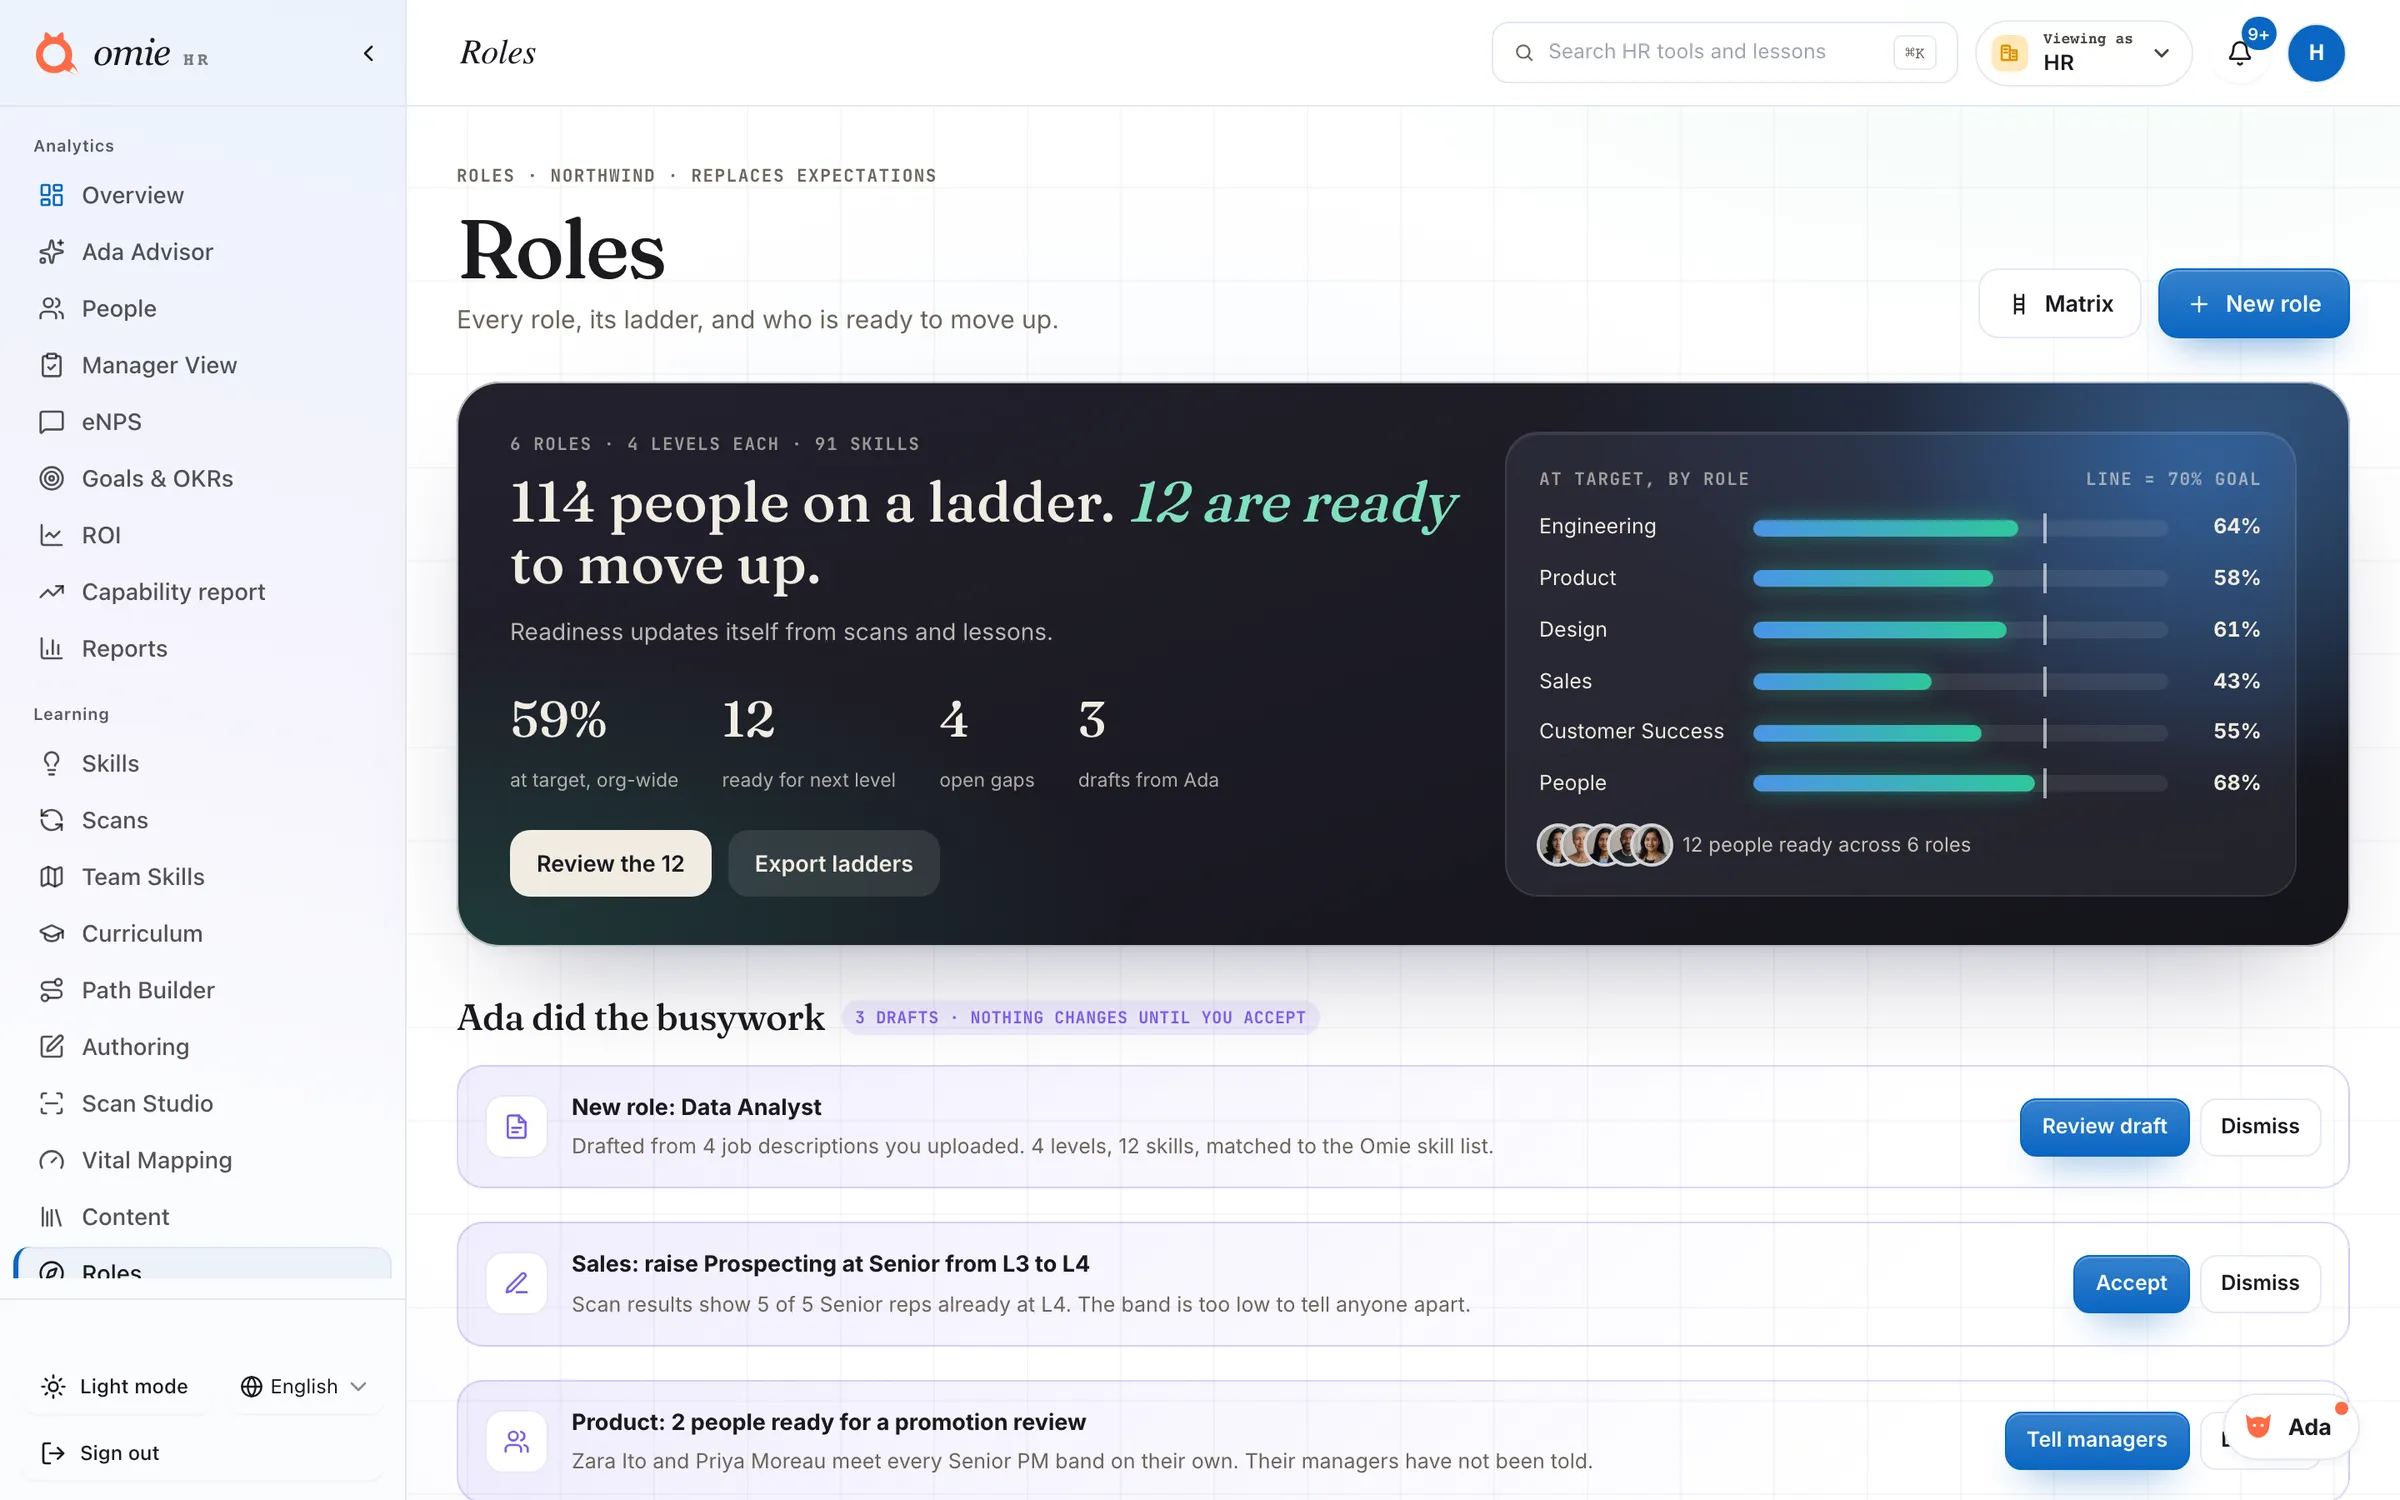
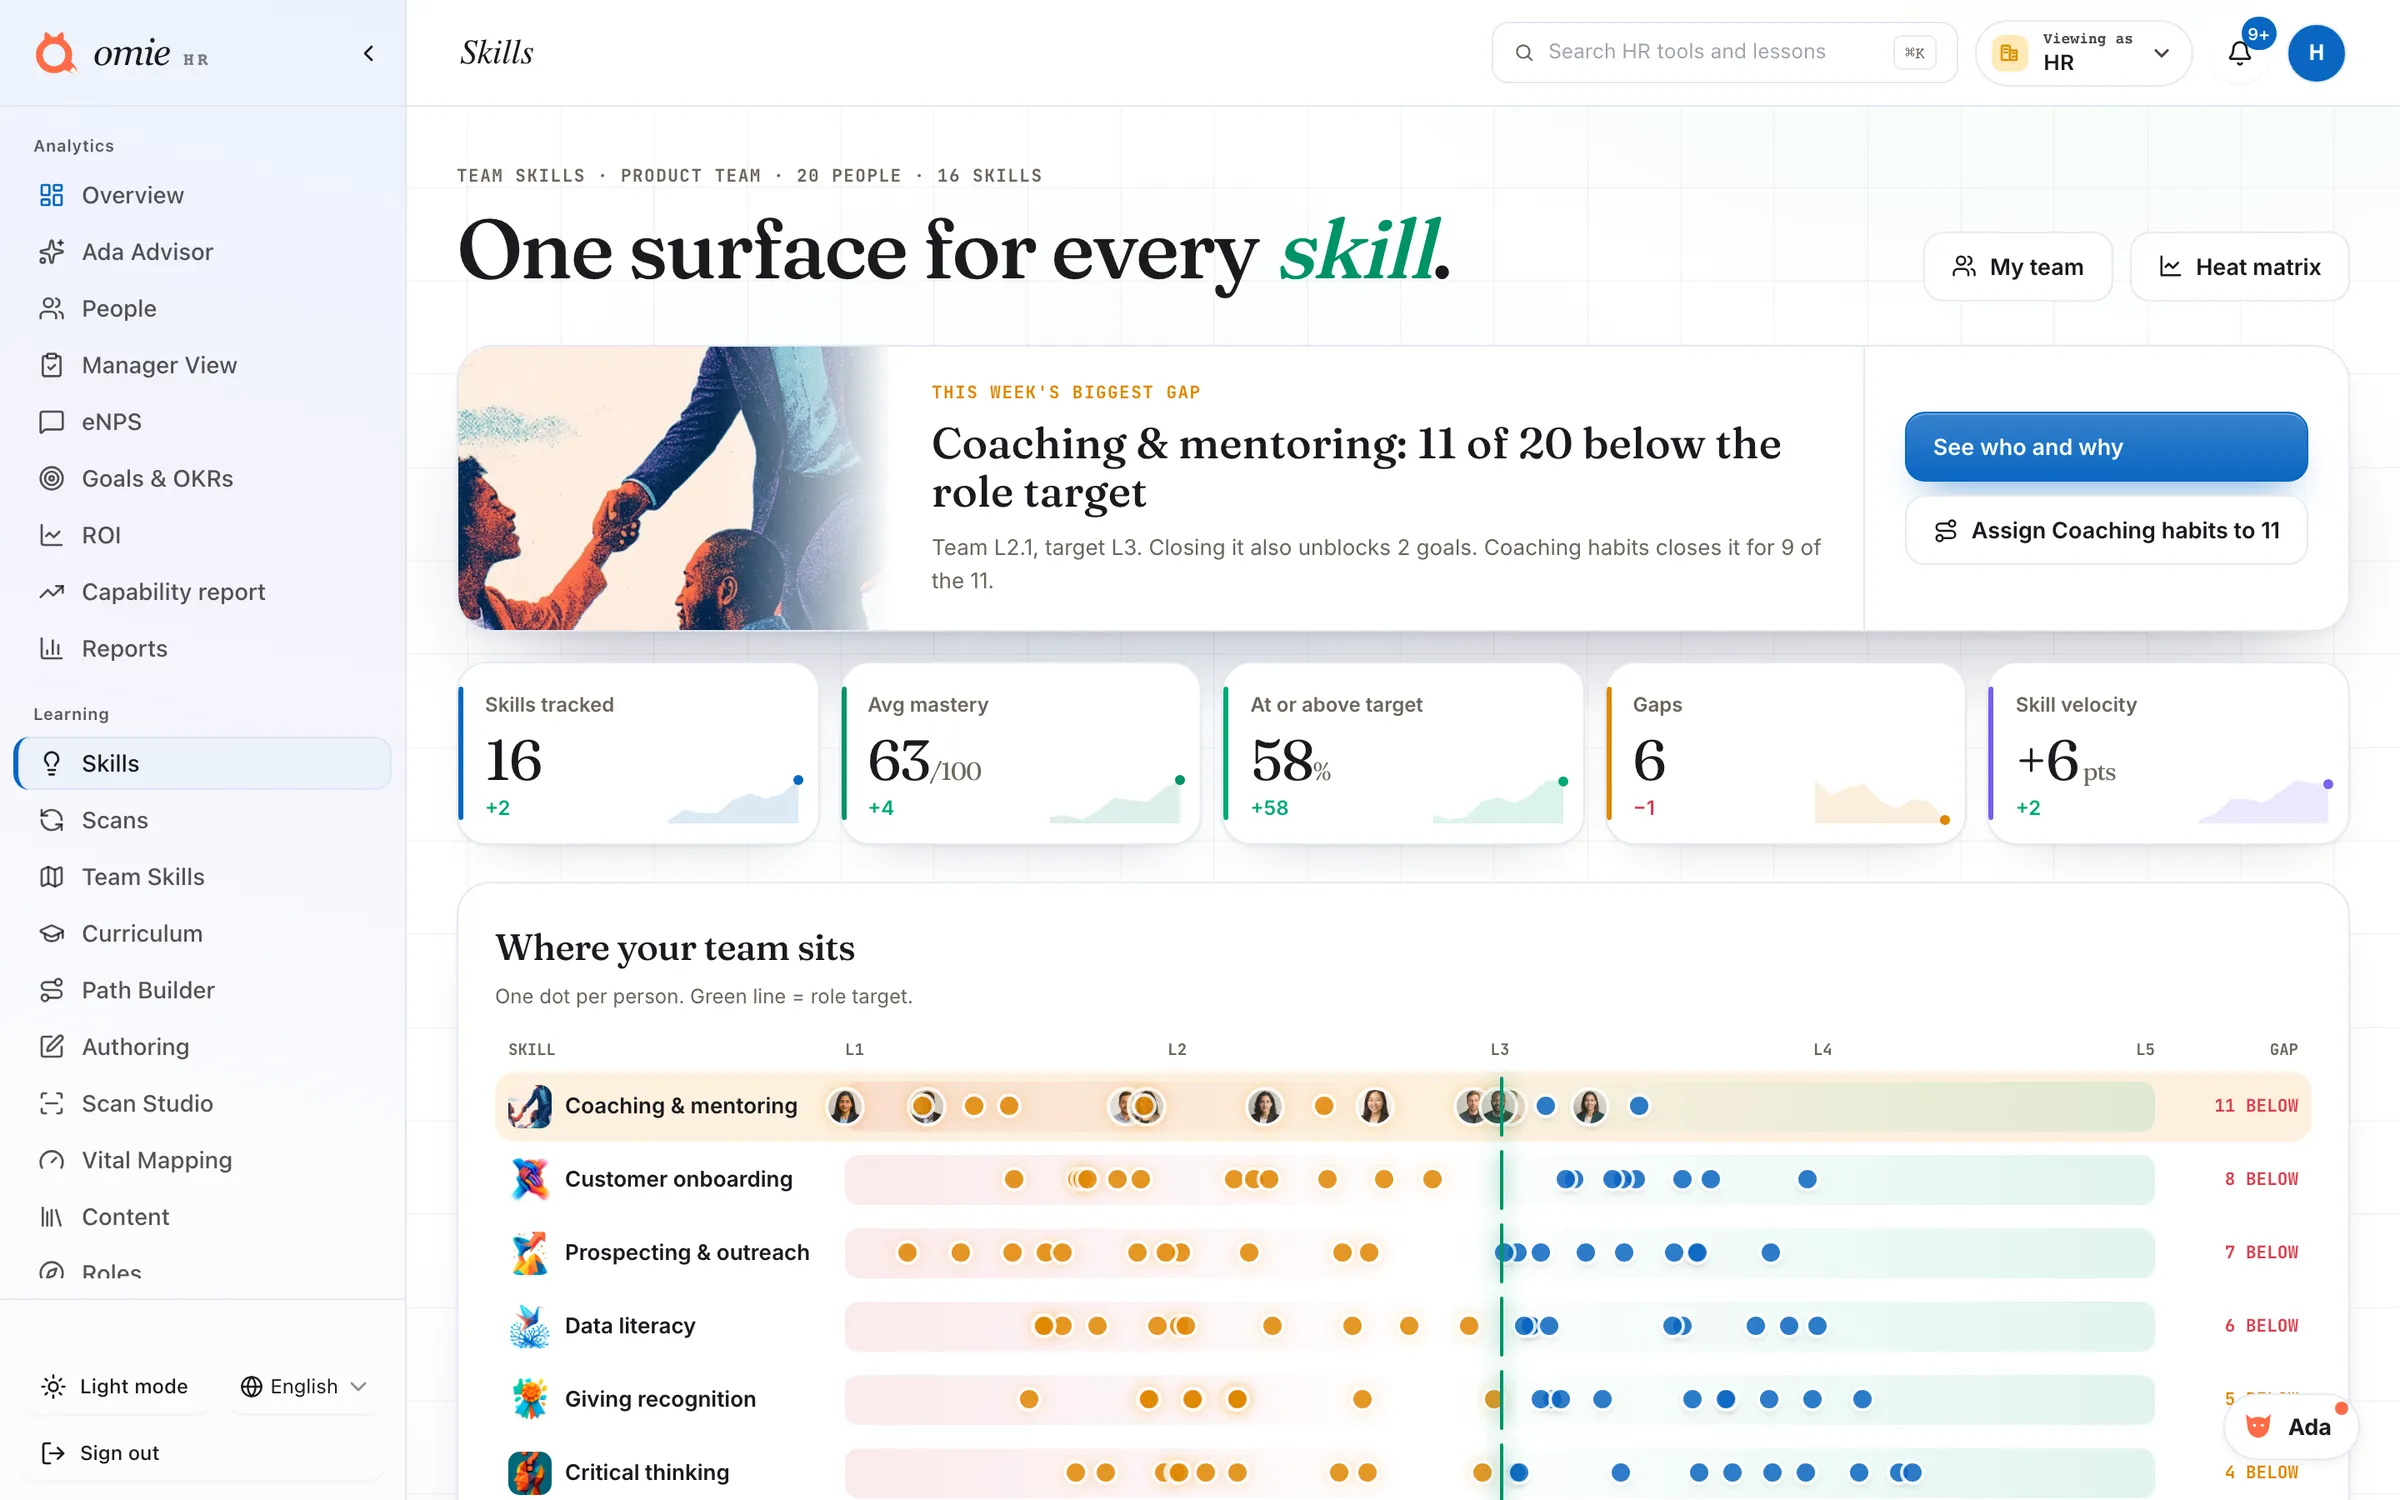
Coverage you can defend.
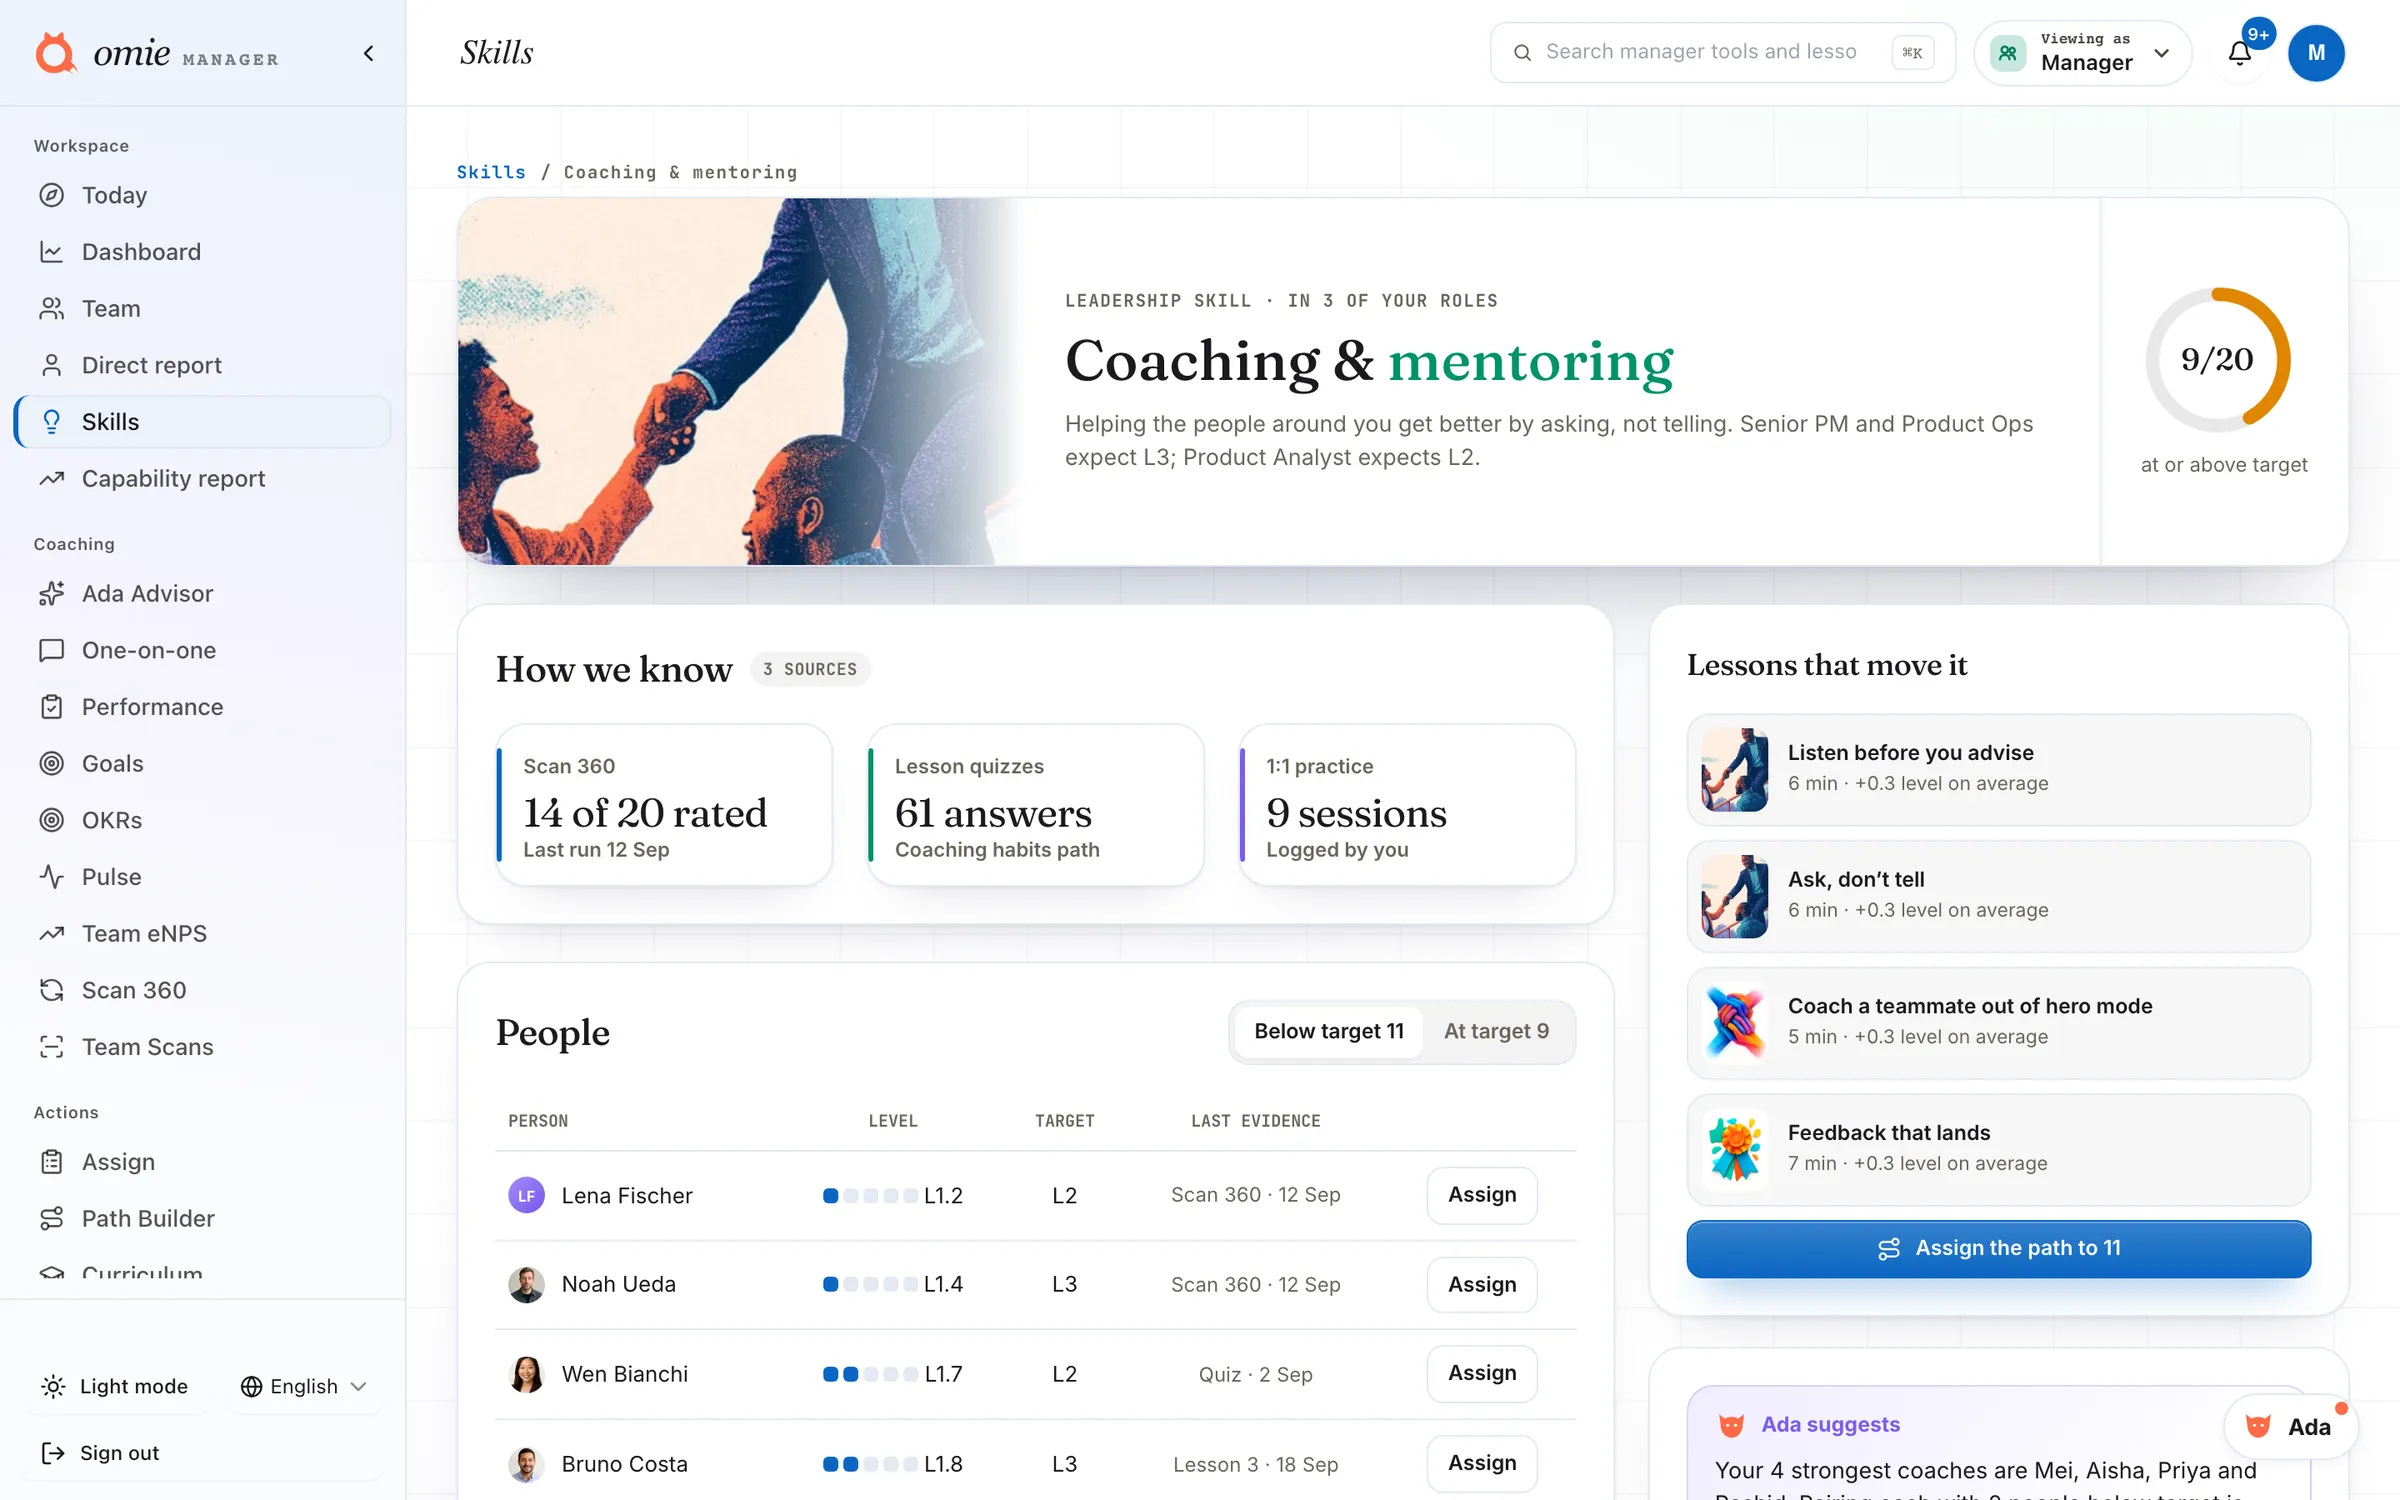
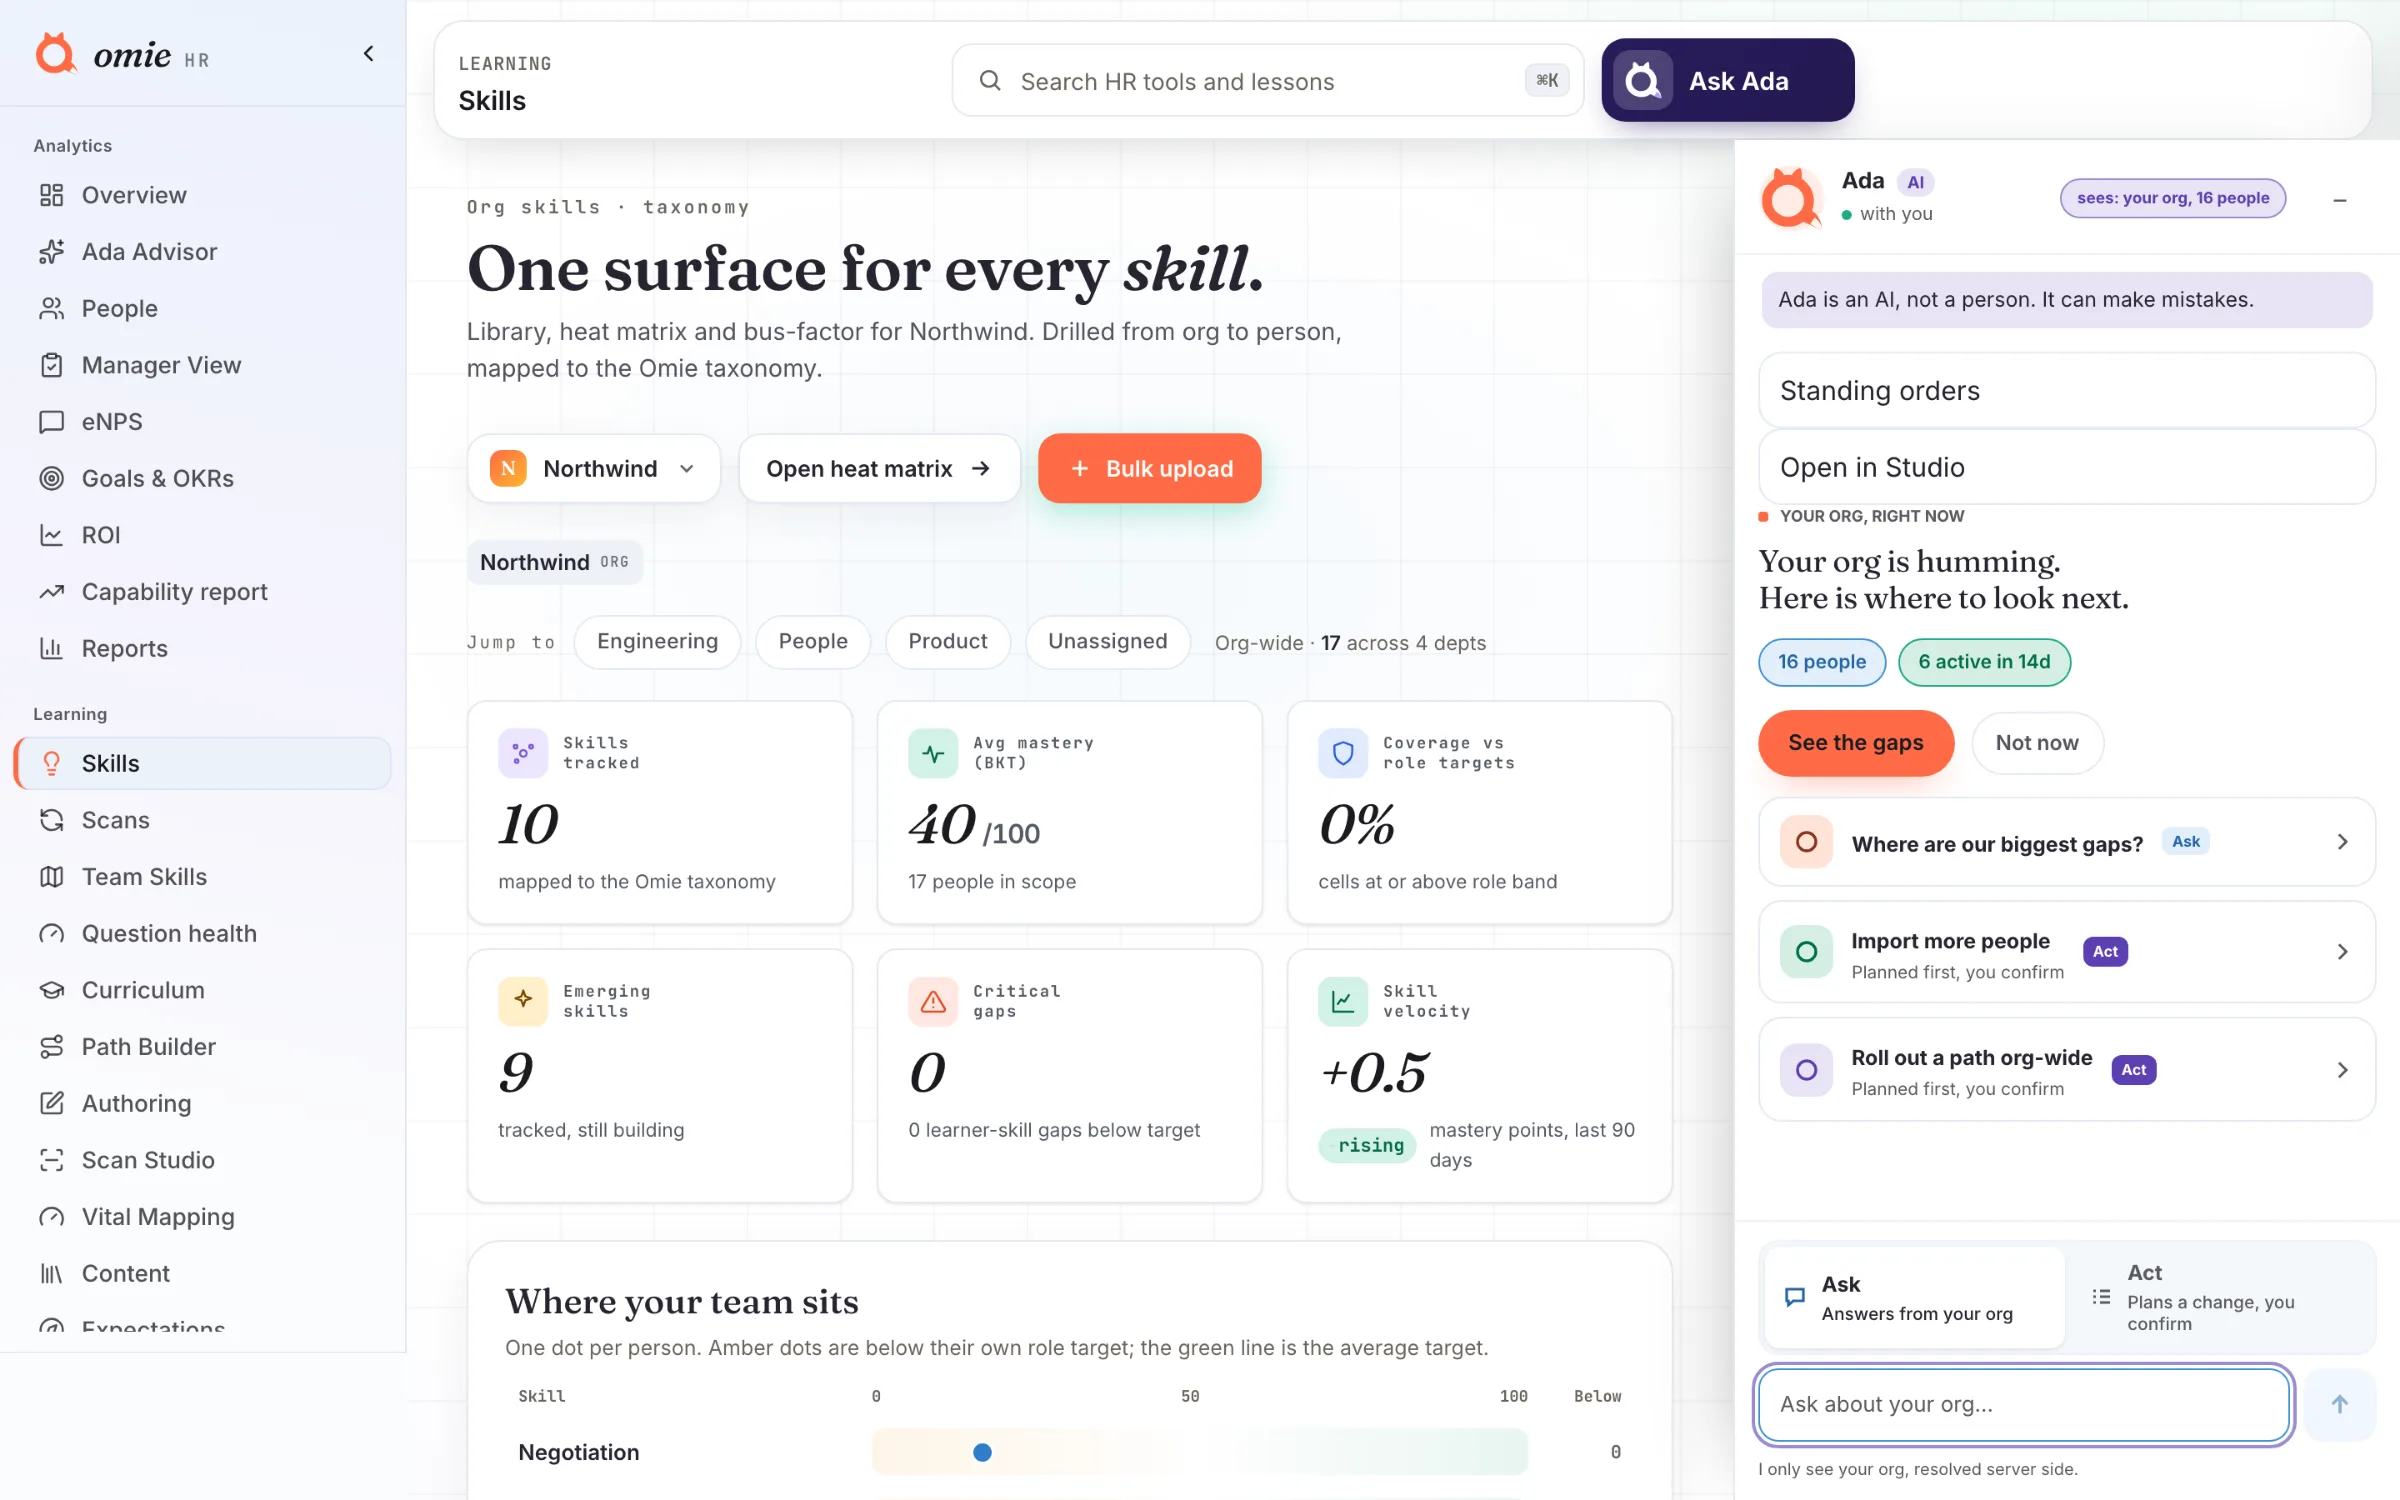
Every role gets a target band, and every person gets an honest reading. The skills matrix shows where coverage holds, where it thins, and which skills live inside a single head.
- A heat matrix from the whole org down to one person
- Coverage against role targets, cell by cell
- Bus factor flags the skills only one person holds
eNPS people actually answer.
Level one is only honest when people feel safe answering. Omie runs eNPS and pulse surveys on a cadence you set, and holds results back until enough responses land to keep every answer anonymous.
- Recurring cadence with reminders, no spreadsheet wrangling
- Results stay hidden until the anonymity floor is met
- The trend sits next to learning and behavior on one overview
The gaps that need a decision.
A gap is real only when a scanned mastery band sits below the band the role should hit. Nothing is invented. Each row joins live scan results to the targets you set, then proposes the path that closes it.
The band model compares observed mastery to the role target on a one to five scale. No gap appears without a scan behind it, so the list holds up in a review.
- A short list of open gaps, not a wall of red
- Severity, people affected, and time to close on every gap
- One click assigns the closing path
Watch a gap close.
A scan lands, a gap gets flagged, a track goes out, and the board view moves. This is the loop, recreated in HTML so you can watch it run.
Illustration: a role by skill heat matrix fills in from scan results, one low cell is flagged as a gap, a closing track is assigned, and the cell rises to the role band.
This matrix, with your people in it.
Set role targets, run the first scans, and read your own coverage this week. No card to start.
Close it with a track people finish.
Every gap proposes the track that closes it. Tracks run ten minutes a day, tune themselves to each learner, and report progress back into the same coverage view, so you watch the gap close.
- Assign a closing path in one click, straight from the gap row
- Adaptive tracks re-tune to every answer, never one size fits all
- Progress rolls back into coverage and the Kirkpatrick view
Author a track from one doc.
Your playbooks, policies and product docs become learning. Upload a document and Omie drafts a track across 25 lesson formats, held for your review before anything reaches a learner.
- 25 lesson formats, from role plays to worked examples
- Human review before anything ships to a learner
- Compliance training authored once, tracked against the audit window
Draft track · 5 lessons · ready to review
Board-ready, honestly.
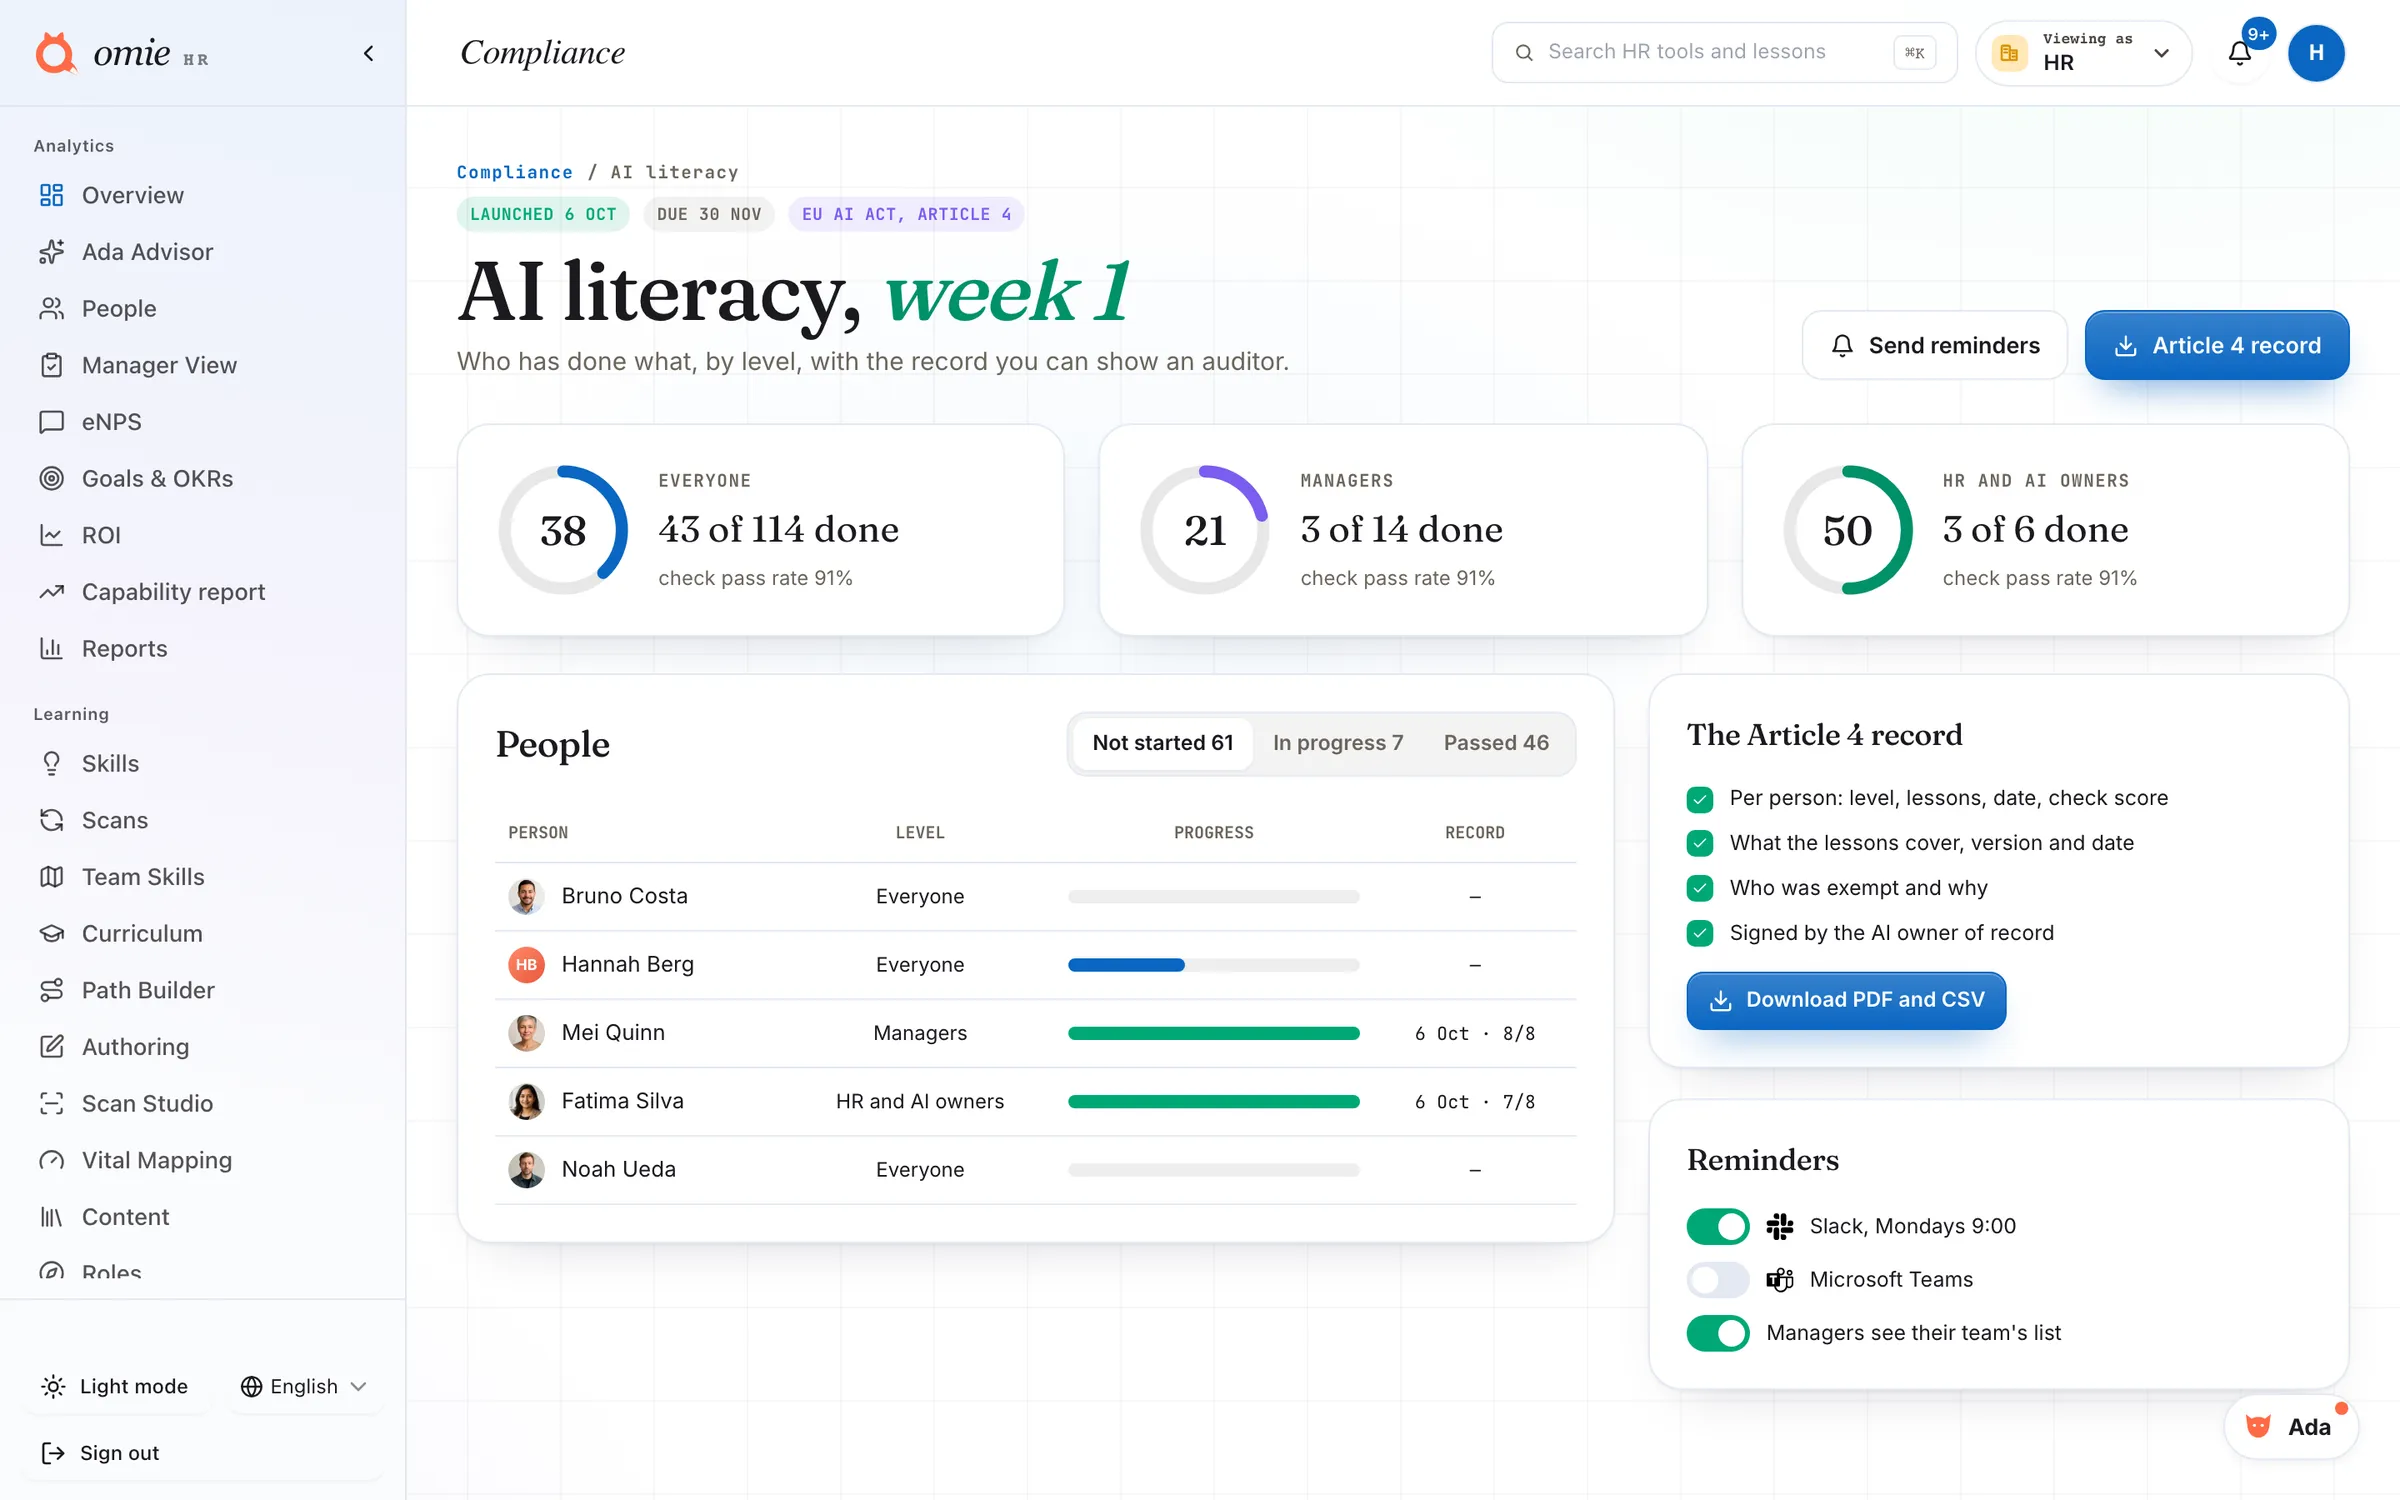
Compliance is tracked against the audit window, with reminders and escalation before it closes. When the quarter ends, one click composes the board pack. And on our own paperwork: SOC 2 is in progress, and we say so.
- Overdue training surfaced before the auditor asks
- A board pack your leadership can skim in two minutes
- Every figure traces back to the screens above
Plugs into your stack.
SAML and the audit stream (SCIM is coming) your IT review will ask about. The team says yes, and IT has nothing to block.
Demo tenant. SSO ships on the Business plan; SCIM is coming.
 SlackReminders and check-ins
 Microsoft TeamsReminders and check-ins
Run the math on your team.
Three sliders, one conservative model. Every output is illustrative, and the formula is printed under the card so your finance team can check it.
The outputs update as you drag.
Illustrative arithmetic from your own inputs: hours × 4.33 weeks × hourly salary, against $15 per seat a month. Not a promise.
Three sentences we kept hearing.
We built this page around what HR and L&D leaders told us in research conversations. Roles shown, no invented names, no stock faces.
Role-attributed lines from our research, not named customers. When we have customer logos, they will be real ones, with permission.
My LMS says 92 percent complete. My board asks what changed. I never had an answer that connected those two sentences.
We did not invent a metric. We report the ones your board already trusts.
Kirkpatrick, 1959
The four levels of training evaluation. Reaction, learning, behavior, results. Still the standard your leadership learned.
Phillips ROI
Adds the fifth level and puts a dollar figure on the program, so learning finally speaks the language of the P and L.
Employee eNPS
The honest read on how people feel about the work and the learning behind it, gathered with an anonymity floor.
Bayesian Knowledge Tracing
The mastery model. A defensible probability per skill from real signals, never a completion bar dressed up as progress.
For HR and L&D, in practice.
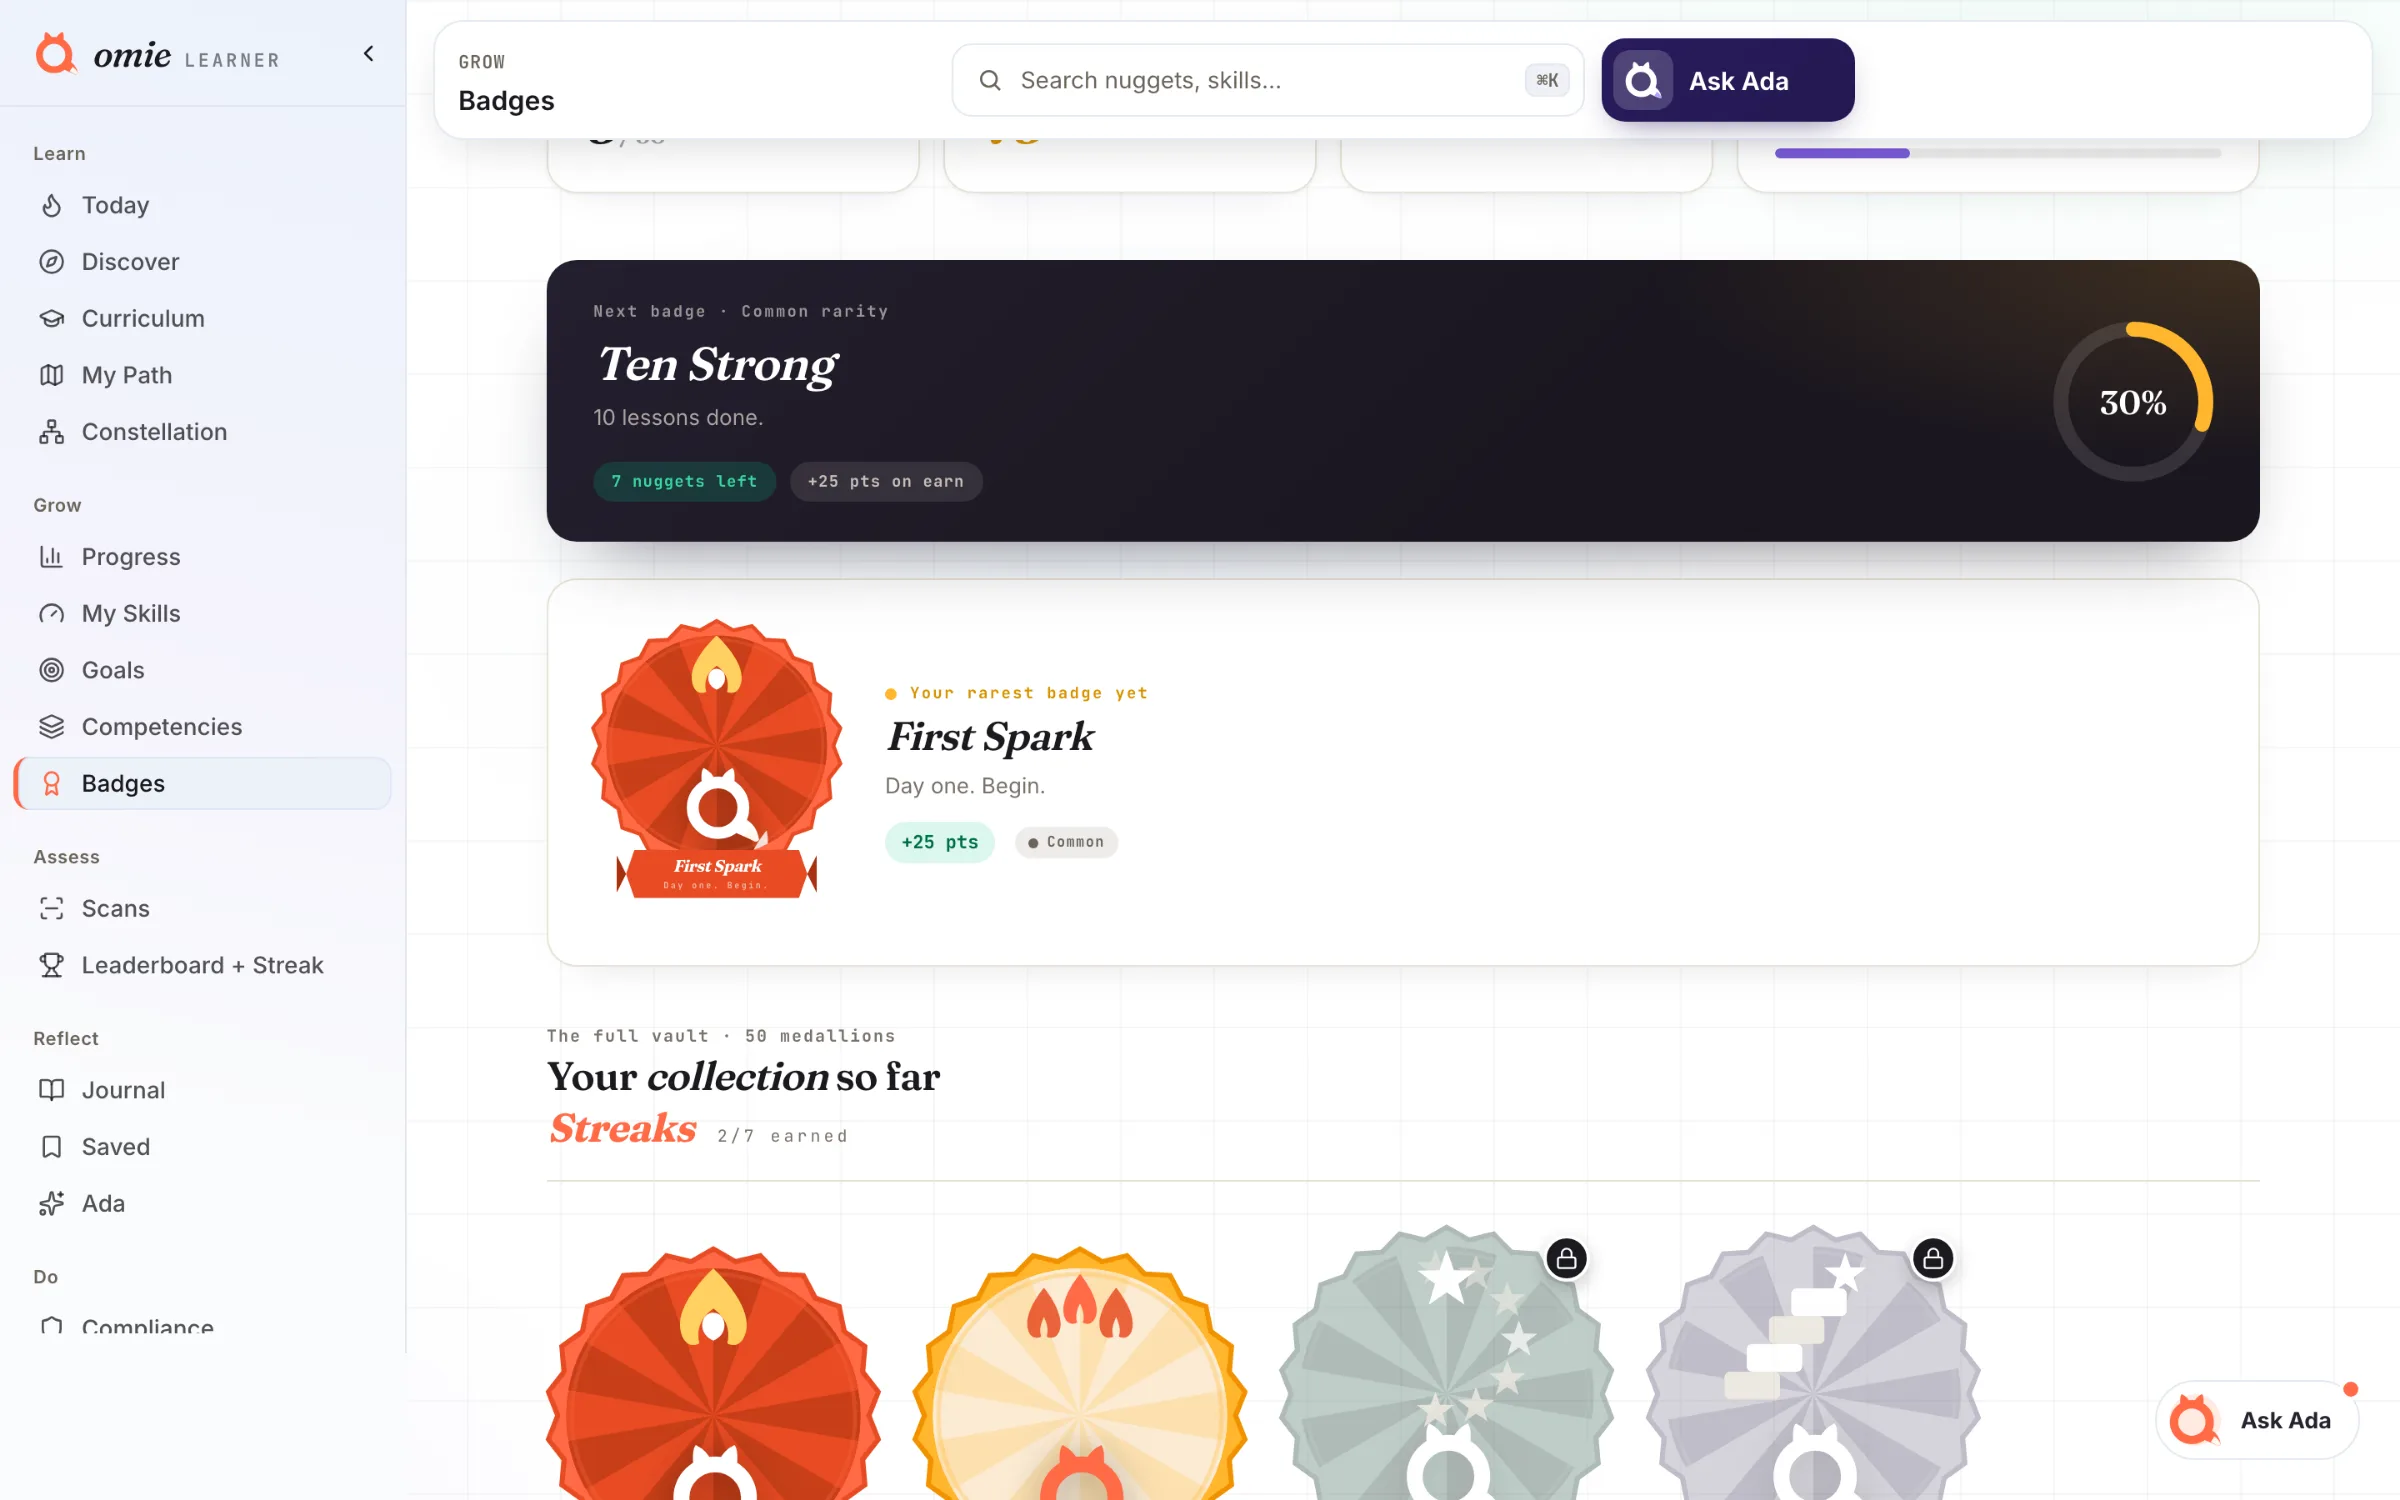
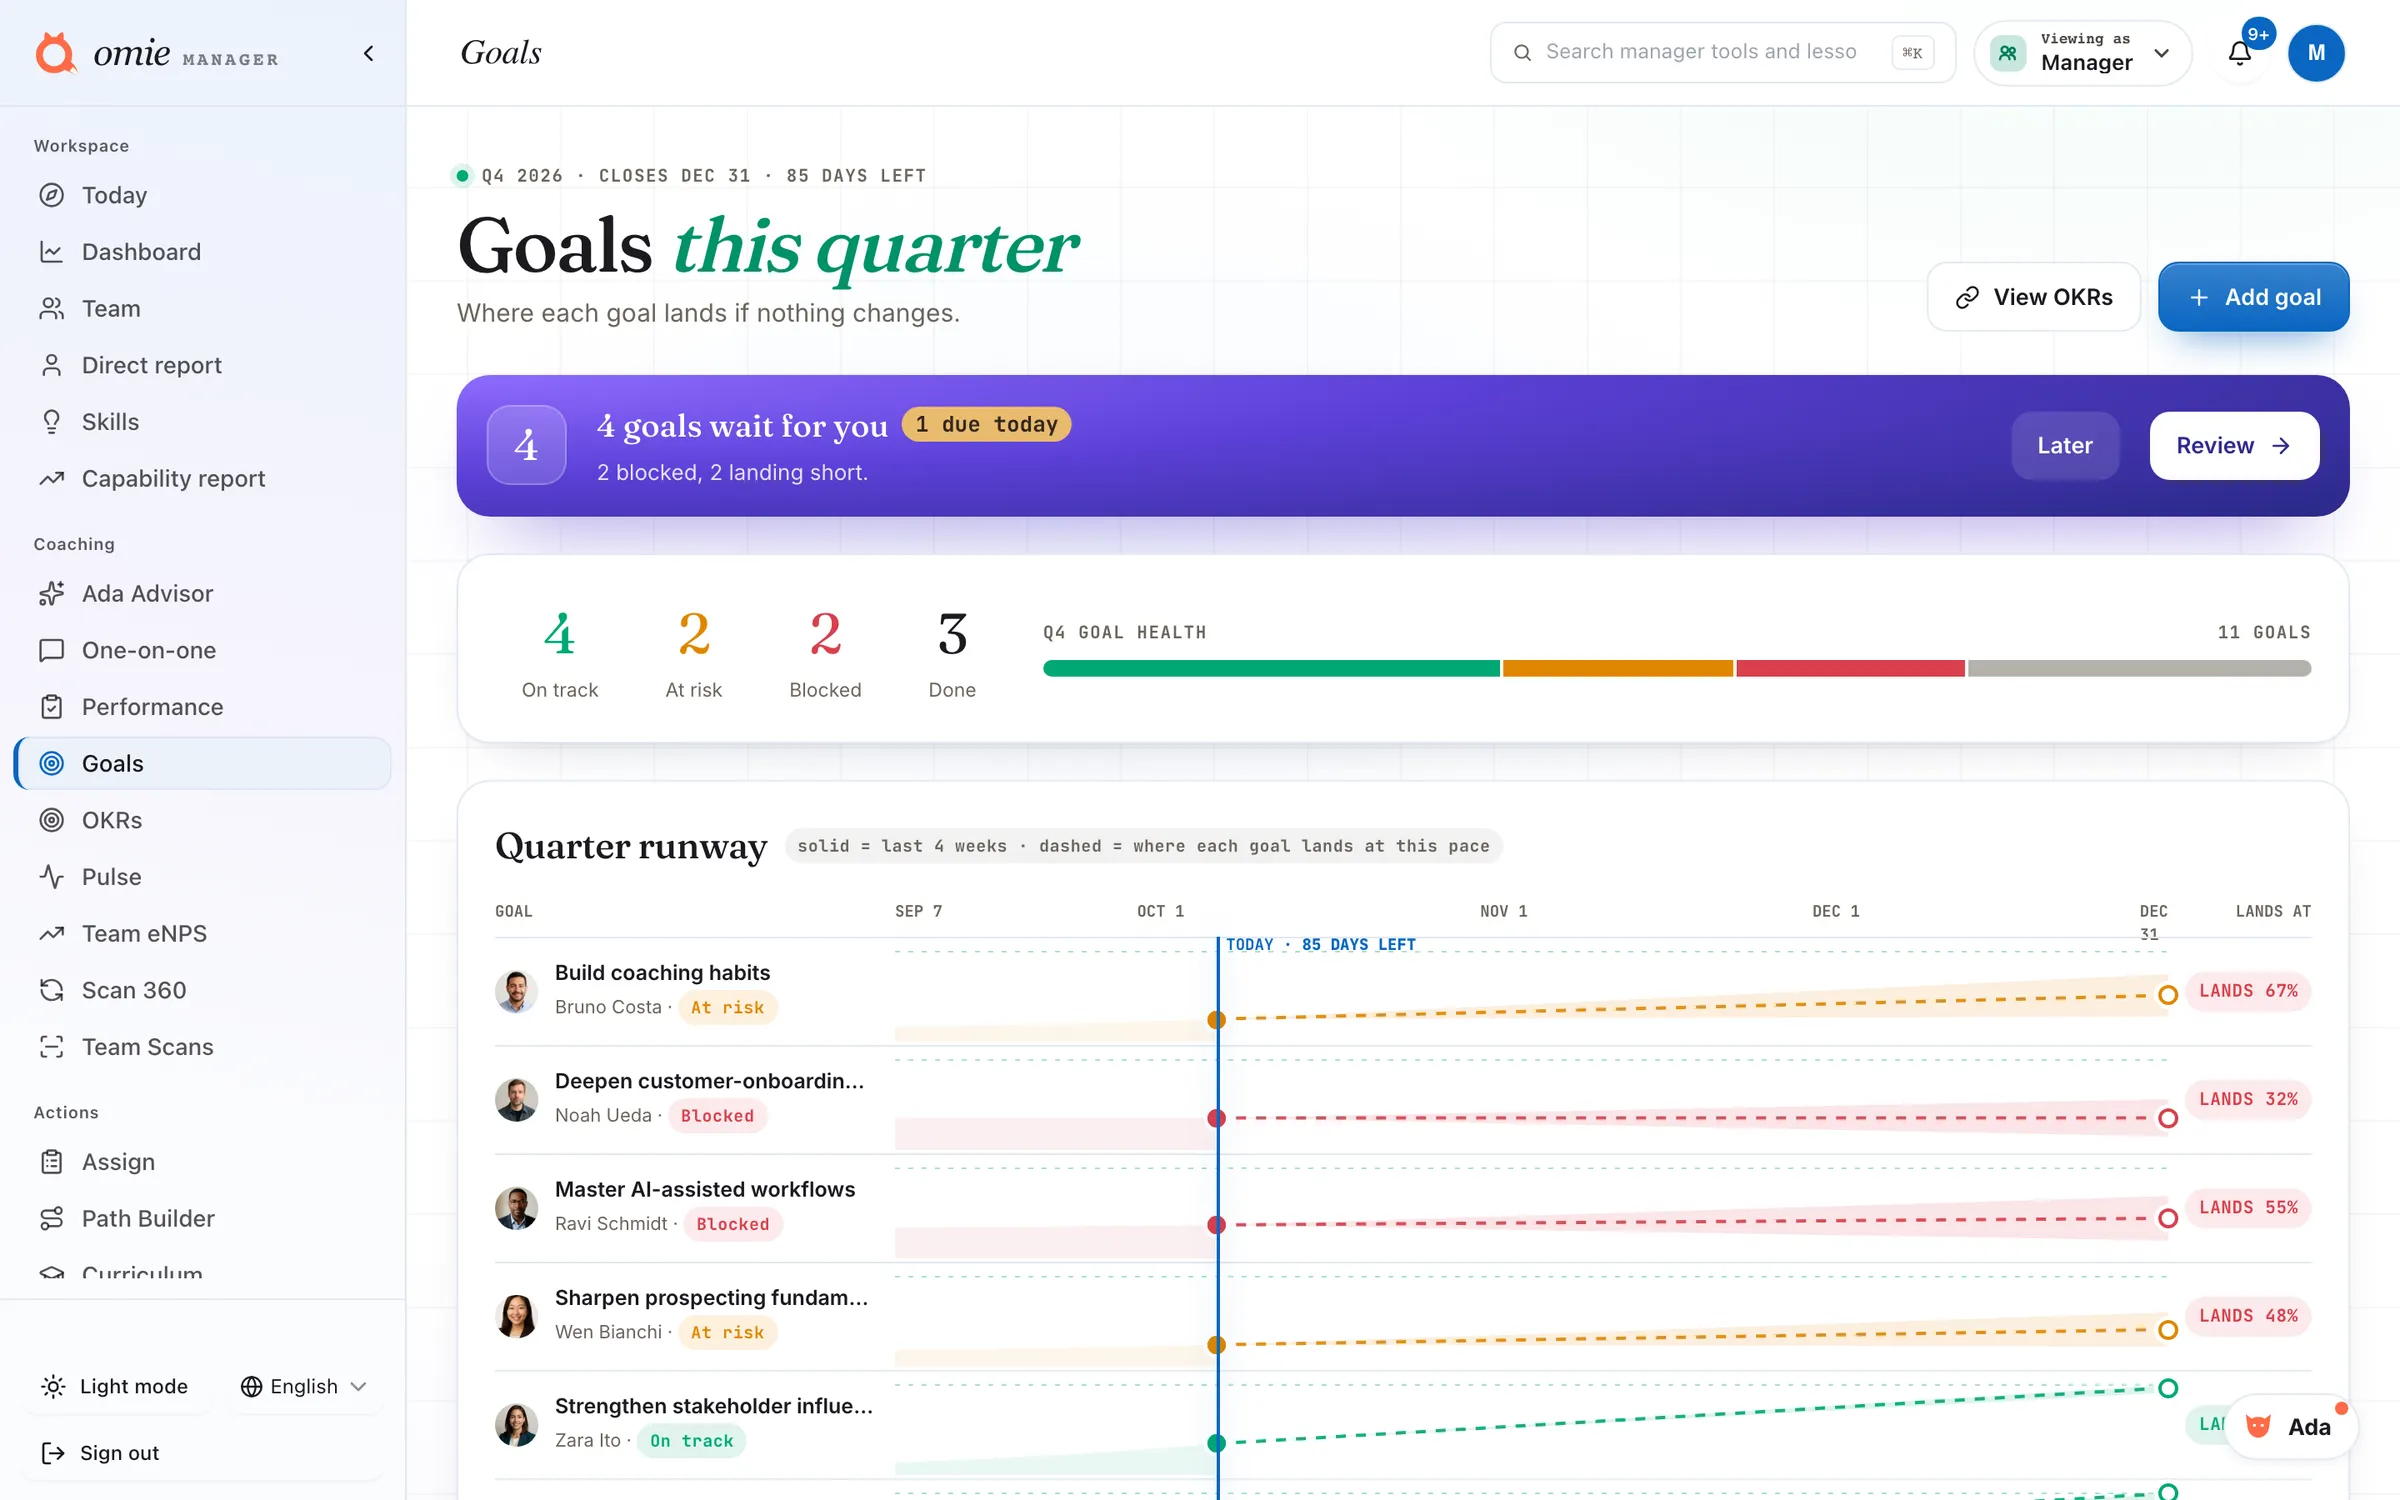
On real Omie screens. Product facts are marked; examples say so.
Your first honest board pack is waiting.
Four levels, one dollar figure, and only the gaps that need a decision. Omie runs on the web and on mobile with one account, so the learning happens wherever your people are.
No card to start. The screens are real, the figures on them illustrative.